

Results 1 to 2 of 2
Thread Information
Users Browsing this Thread
There are currently 1 users browsing this thread. (0 members and 1 guests)
 LinkBack URL
 About LinkBacks
-
05-27-2014, 12:33 PM #1Senior Member


- Join Date
- Aug 2008
- Location
- PARADISE (San Diego)
- Posts
- 99,040
The changing face of American immigration
TUESDAY, MAY 27, 2014
The changing face of American immigration, in one GIF
Updated by Dara Lind on May 27, 2014, 11:40 a.m. ET @DLind dara@vox.com
 The face of American immigration before 1965.Universal History Archive/UIG/Getty
The Pew Research Center has created a series of charts showing changes in America's immigrant population, going back to before the Civil War. The takeaway: immigration laws and policy have played a huge role in shaping immigrant demographics. It's impossible to understand why different immigrant groups have come to the US at different times without understanding who was allowed to come.
Before 1965, Pew shows, Germany sent more immigrants to the United States than any other country. Since 1965, it's been replaced by Mexico. This GIF shows the states where the two immigrant groups have dominated over the last 150 years:
via Pew Research Center
Before 1965: a racist system that froze demographic change
Splitting the history of American immigration into "before 1965" and "after 1965" isn't arbitrary. 1965 is the year that Congress passed a law that essentially created the immigration system we still use today.
From World War I to 1965, the immigration system was designed, essentially, to keep the United States white. Rice University sociologist Stephen Klineberghas called it "unbelievable in its clarity of racism."
Each country was given a certain quota of immigrants who were allowed to come to the US each year. Theoretically, that quota was supposed to be based on how many immigrants from that country were already in the US so as to preserve "ethnic balance."
CONGRESS WANTED TO RESET THE CLOCK TO 1890, WHEN ONLY "SUPERIOR" EUROPEANS CAME TO THE US
But when the law setting these quotas was passed in 1924, Congress decided that future immigration should be based on who was in the country as of 1890. The reason? Legislators were worried about the recent influx of Southern and Eastern Europeans (largely Italians and Jews), and wanted to reset the clock back to a time when only "superior" Europeans came to the United States.
Combined with existing laws that prevented any Asian-Americans from coming into the country, the laws of the 1920s basically froze the demographics of the immigrant population in place until 1965. That's why the GIF above shows Germans continuing to dominate immigration in 1910, 1930, and 1960 it was nearly inevitable, given that they were already in the US as of 1890.
Policy still shapes the face of the immigrant population
In 1965, Congress jettisoned the old system. Since then, who's allowed to immigrate to the US is mostly based on having family in the country or having particular professional skills. When President Johnson signed the 1965 bill, hedidn't think it was going to revolutionize the demographic balance of the United States. He was wrong. In particular, the ability to bring over family members meant that immigrants from every region of the world could establish immigration communities in the US:
via Pew Research Center
But the 1965 law didn't "open the borders" in the least. Who comes to the US is still shaped by both old and new immigration laws. For one thing, immigrants who'd been able to come in under the old, racist system continued to have an advantage in bringing over family members there were more of them, and they were more likely to be citizens or green-card holders. For another thing, the current immigration system sets a firm cap on how many family visas each country can take each year. For the last several decades, that's meant that many more immigrants apply to enter the US on family visas than are allowed to but only from four countries: Mexico, China, the Philippines, and India.
If those country caps were lifted, the map above might look very different.
The same is true of any other tweak to US immigration law. The story of who's come to America over its history, and how that has changed, is largely the story of who America has decided it wants to allow to come.
CARD 4 OF 28LAUNCH CARDS
How does legal immigration work right now?
The two main types of legal immigration are work-based and family-based immigration. Both of these rely on sponsors who already live in the United States.
On the work-based side, employers apply to sponsor would-be employees for temporary visas. These visas are capped. There are 65,000 H1B visas each year, the most common visa for high-skilled workers (although other visas for highly-educated workers are available). At the moment, companies hit this cap very quickly. There are 66,000 H2B visas for "low-skilled" workers a year; at the moment, companies also hit this cap, but not nearly as quickly as visas for high-skilled workers. There are no quotas for agricultural visas.
On the family-based side, US citizens and permanent residents with green cards can apply to sponsor their relatives for green cards. The wait time can vary based on the sponsor's citizenship status, the relationship, and the countries involved.
If a would-be immigrant does not have a relative or employer in the US willing to sponsor her, there are a few other options. If you're incredibly rich, you can come to the US on an investor visa. The diversity visa lottery offers 40,000 green cards a year to people in countries that haven't historically had large immigrant populations in the United States.
Alternatively, would-be immigrants who fear persecution in their home country can apply for refugee status or asylum.
Other than that, it's impossible to come legally to live in the United States (setting aside tourist and student visas). Here's a helpful flowchart of this system.
Immigration reform 28 CARDS / EDITED BY DARA LIND UPDATED MAY 4 2014, 2:34P
http://www.vox.com/2014/5/27/5754162...ion-in-one-gif
NO AMNESTY
Don't reward the criminal actions of millions of illegal aliens by giving them citizenship.
Sign in and post comments here.
Please support our fight against illegal immigration by joining ALIPAC's email alerts here https://eepurl.com/cktGTn
-
06-01-2014, 10:48 PM #2Senior Member

- Join Date
- May 2007
- Location
- South West Florida (Behind friendly lines but still in Occupied Territory)
- Posts
- 117,696
Mapping 100 Years Of US Immigration By State
Mapping 100 Years Of US Immigration By State
 Submitted by Tyler Durden on 06/01/2014 15:22 -0400
Several days ago, we looked at the big picture of US immigration, presenting the place of origin of America's 40 million foreign-born residents. However, as is always the case with the US, focusing on the big picture at the national level ignores the nuances at the state level.
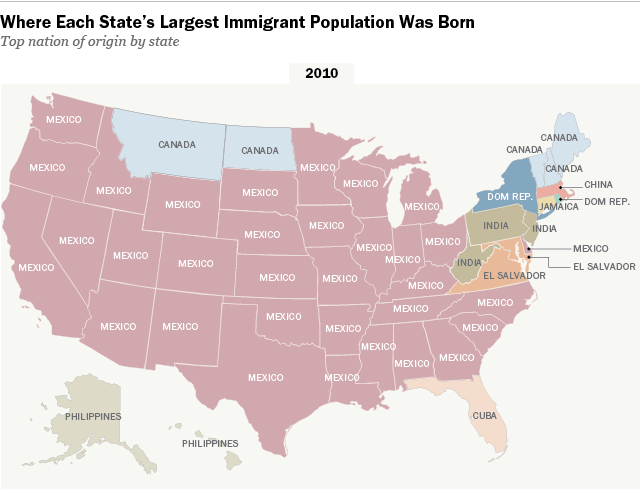
The following two charts using Pew Research data, compiled by the WaPo, show the dramatic changes in the land of origin of US immigrants, beginning with 1910 when Germany was the primary driver of US-born residents, accounting for 18% of US immigrants, and proceeding through 2010, when Mexico has become the the biggest source of foreign-born residents: the birthplace of 29% of all immigrants in the US.
1910:

and 2010:

Some observations from WaPo:Of note: while until 1970, the percentage of US population that was foreign born steadily declined, reaching just 5%, over the past 40 years, as the organic growth rate of US-born population has declined below the rate of immigration, the percentage of immigrants as a % of total has been rising steadily and is now back to a level not seen in the past century.
With more than 40 million immigrants, the United States is the top destination in the world for those moving from one country to another. Mexico, which shares a nearly 2,000-mile border with the U.S., is the source of the largest wave of immigration in history from a single country to the United States.
But todays volume of immigrants, in some ways, is a return to Americas past. A century ago, the U.S. experienced another large wave of immigrants. Although smaller at 18.2 million, they hailed largely from Europe. Many Americans can trace their roots to that wave of migrants from 1890-1919, when Germany dominated as the country sending the most immigrants to many of the U.S. states, although the United Kingdom, Canada and Italy were also strongly represented.
In 1910, Germany was the top country of birth among U.S. immigrants, accounting for 18% of all immigrants (or 2.5 million) in the United States. Germans made up the biggest immigrant group in 17 states and the District of Columbia, while Mexico accounted for the most immigrants in just three states (Arizona, New Mexico and Texas). Behind Germany, the second-most number of immigrants in the U.S. were from Russia and the countries that would become the USSR (11%, or 1.6 million).
Since 1965, when Congress passed legislation to open the nations borders, immigrants have largely hailed from Latin America and Asia. In states that have attracted many immigrants, the current share of immigrants is below peaks reached more than a century ago. Today there are four states (California, New York, New Jersey and Florida) in which about one-in-five or more people are foreign born. California peaked in 1860 at 39.7%, when China was the top country of birth among immigrants there. Meanwhile, New York and New Jersey peaked in 1910 at 30.1% (Russia and the USSR) and 26.2% (Italy), respectively.
Today, five times as many immigrants in the U.S. are from Mexico than China, the country with the second-highest number of immigrants (5% of all immigrants in the U.S., or 2.2 million). Mexico is the birthplace of 29% (or 11.7 million) of all immigrants in the United States. Immigrants born in Mexico account for more than half of all of the foreign born in four states: New Mexico (72.4%), Arizona (60.2%), Texas (59.7%) and Idaho (53.5%).

Finally, here is why the Germans are losing to Mexicans, at least when it comes to US immigration by state: an animated map of German vs Mexican immigration from 1850 until modern days.

http://www.zerohedge.com/news/2014-0...igration-stateJoin our efforts to Secure America's Borders and End Illegal Immigration by Joining ALIPAC's E-Mail Alerts network (CLICK HERE)


 Reply With Quote


Similar Threads
-
Changing face of illegal immigration is female
By FedUpinFarmersBranch in forum illegal immigration News Stories & ReportsReplies: 2Last Post: 06-28-2008, 01:05 PM -
The changing face of the heartland
By kniggit in forum General DiscussionReplies: 1Last Post: 02-18-2008, 09:27 AM -
Hispanic immigration changing face of county
By Brian503a in forum illegal immigration News Stories & ReportsReplies: 0Last Post: 11-14-2005, 02:05 PM -
Hispanic immigration changing face of county
By had_enuf in forum illegal immigration News Stories & ReportsReplies: 0Last Post: 11-14-2005, 08:11 AM -
Changing face of Mesa
By Brian503a in forum illegal immigration News Stories & ReportsReplies: 0Last Post: 10-23-2005, 08:23 PM


Hundreds of migrants on trains arrive at El Paso-Juarez border
04-25-2024, 01:09 PM in illegal immigration News Stories & Reports