

Results 1 to 2 of 2
Thread Information
Users Browsing this Thread
There are currently 1 users browsing this thread. (0 members and 1 guests)
 LinkBack URL
 About LinkBacks
-
06-12-2019, 04:00 PM #1Senior Member


- Join Date
- Aug 2008
- Location
- PARADISE (San Diego)
- Posts
- 99,040
Mexicans decline to less than half the U.S. illegal alien population
JUNE 12, 2019
Mexicans decline to less than half the U.S. unauthorized immigrant population for the first time
BY JEFFREY S. PASSEL AND DVERA COHN

The number of Mexican unauthorized immigrants in the United States declined so sharply over the past decade that they no longer are the majority of those living in the country illegally, according to new Pew Research Center estimates based on government data. In 2017, there were 10.5 million unauthorized immigrants in the U.S., including 4.9 million Mexicans.
The decrease in the Mexican born was the major factor driving down the overall population of unauthorized immigrants in the U.S., which in 2017 was 1.7 million below its peak of 12.2 million in 2007.
The number of Mexican unauthorized immigrants declined because more left the U.S. than arrived.
Mexicans remain a much larger percentage of all unauthorized immigrants than those from any other birth country. But their 47% share of U.S. unauthorized immigrants in 2017 amounted to less than a majority for the first time since the beginning of a long era of growth in illegal immigration a half century ago. That rise began after passage of a major overhaul of immigration policy in 1965, which imposed the first limits on immigration from Western Hemisphere countries, including Mexico, and coincided with the end of the Bracero program that had allowed temporary farm workers from Mexico to work legally in the U.S.
The number of Mexican unauthorized immigrants has fallen by 2 million since its peak of 6.9 million in 2007 and was lower in 2017 than in any year since 2001.
Similarly, the number of apprehensions of Mexicans at the U.S. border also has fallen over the decade, a trend that began even earlier. In fact, apprehensions of non-Mexicans outnumbered those of Mexicans for the past three fiscal years, according to federal statistics.
As the number of Mexicans decreased, unauthorized immigrants from other parts of the world increased.
There were 5.5 million non-Mexican unauthorized immigrants in 2017, compared with 5.3 million in 2007.
The non-Mexican number also ticked up from 2016 to 2017, offsetting the decline of Mexicans. As a result, the overall population of unauthorized immigrants statistically did not change in 2017 from the year before; the total in both years was the lowest since 2004.
The decline in unauthorized immigrants from Mexico and rise from other parts of the world is one sign of a change in how recent arrivals to this population enter the country. A growing share of U.S. unauthorized immigrants do not cross the border illegally, but probably arrive with legal visas and overstay their required departure date. These likely overstays have made up a large majority of unauthorized immigrant arrivals since 2010, according to Pew Research Center analysis.
The Centers estimate of unauthorized immigrants includes 1.5 million or more people who have temporary permission to stay in the U.S. but could be subject to deportation by changes in government policy. In 2017, they included about 320,000 people from 10 nations with Temporary Protected Status, about 700,000 beneficiaries of Deferred Action for Childhood Arrivals and a rising number of people who have applied for asylum and are awaiting a ruling.
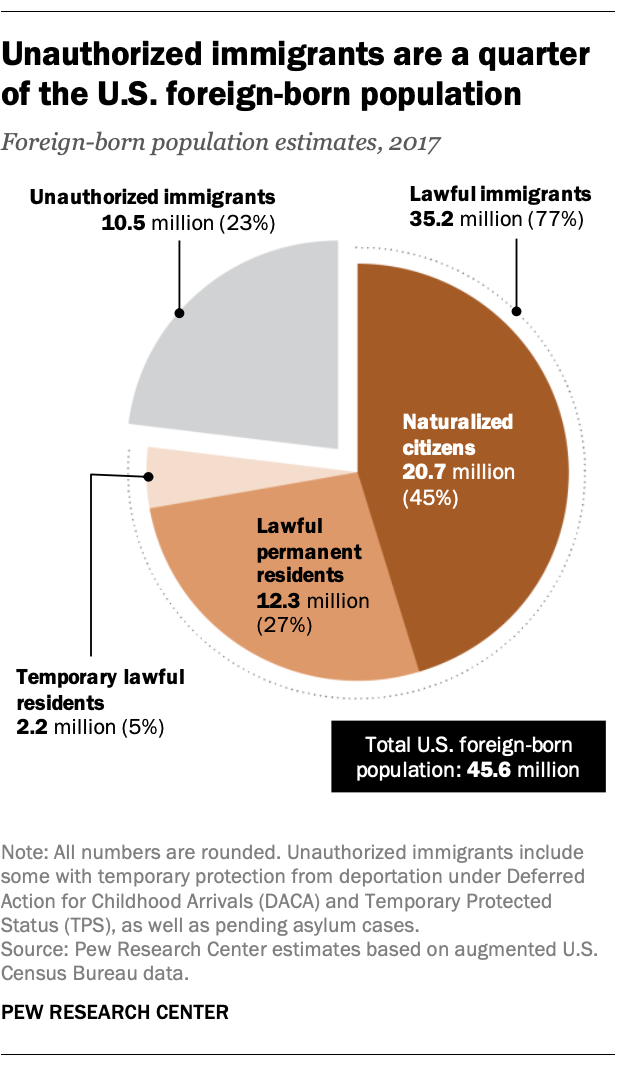 As the number of unauthorized immigrants shrank by 14% from 2007 to 2017, the U.S. lawful immigrant population continued to grow. During this period, the population of lawful U.S. immigrants citizens and noncitizens, on permanent and temporary visas rose by almost a quarter, to 35.2 million.
Unauthorized immigrants were 23% of the 45.6 million foreign-born residents in the U.S. in 2017.
Despite the decline over the decade, the number of unauthorized immigrants in 2017 was triple the 3.5 million in 1990.
Rising numbers from Asia and Central America
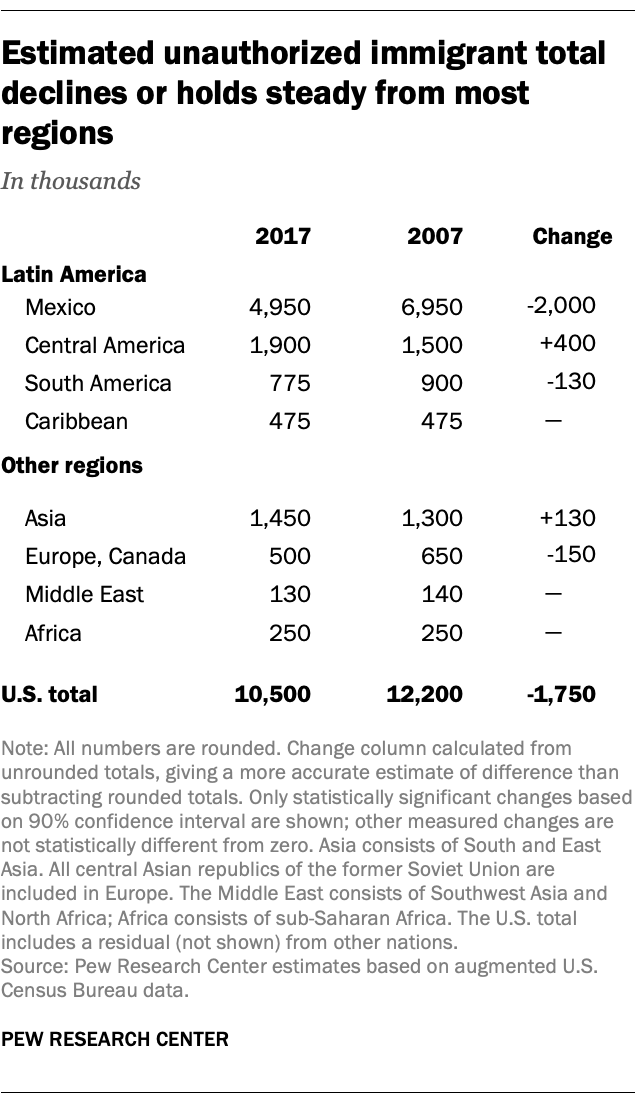 The number of unauthorized immigrants rose over the 2007-2017 decade from two birth regions: Asia and Central America. The numbers declined over the past decade from two others: South America and the combined regions of Europe and Canada. The decline was statistically significant among European-born unauthorized immigrants, but not among those from Canada.
Among the 20 birth countries with the largest number of U.S. unauthorized immigrants, there were statistically significant increases in five from 2007 to 2017. Reflecting the growth in unauthorized immigrants from Central America, they included the three Northern Triangle nations of El Salvador, Guatemala and Honduras, a trend also displayed in rising apprehensions of people from those countries at the border. India and Venezuela also had increases in their U.S. populations of unauthorized immigrants over the past decade.
However, looking at change from a year earlier, Brazil was the only large birth nation whose total unauthorized immigrant population in the U.S. grew by a statistically significant amount from 2016 to 2017.
Unauthorized immigrant totals for largest birth countries
Large birth nations with unauthorized immigrant population declines over the decade, in addition to Mexico, included Colombia, Ecuador and Peru.
There may have been changes in unauthorized immigrant populations from other birth regions and countries, but they were not statistically significant.
Increases in five states and declines in a dozen others
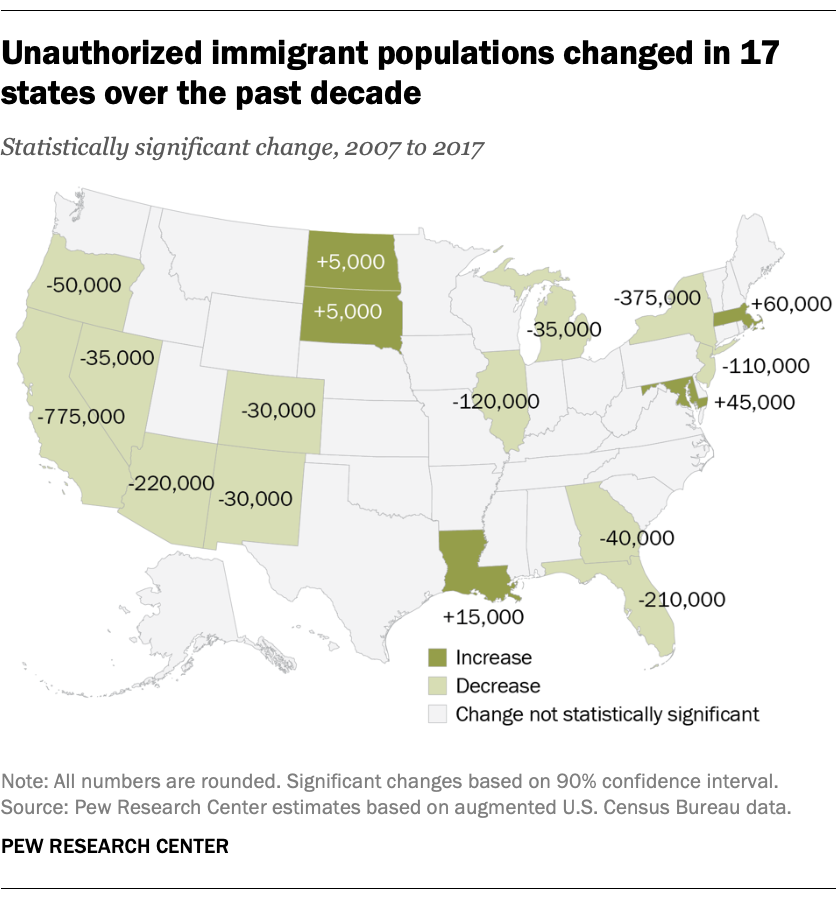 There were five states where unauthorized immigrant populations grew from 2007 to 2017 and 12 where they declined. States with growth included Louisiana, Maryland, Massachusetts, North Dakota and South Dakota.
Those with declines included five of the six states with the largest unauthorized immigrant populations: California, Florida, Illinois, New Jersey and New York (but not Texas, which had no statistically significant change). The other states with fewer unauthorized immigrants in 2017 than in 2007 were Arizona, Colorado, Georgia, Michigan, Nevada, New Mexico and Oregon.
Other states may have had changes, but they were not statistically significant.
Estimates of unauthorized immigrant population for states
How did we estimate the U.S. unauthorized immigrant population?
Long-term residents outnumber more recent arrivals
 The decline in unauthorized immigrants over the decade is largely due to decreases in new arrivals to the U.S., especially by Mexicans (although some unauthorized immigrants also have left, died or were deported). As a result, the unauthorized immigrant population in the U.S. increasingly is made up of longer-term residents.
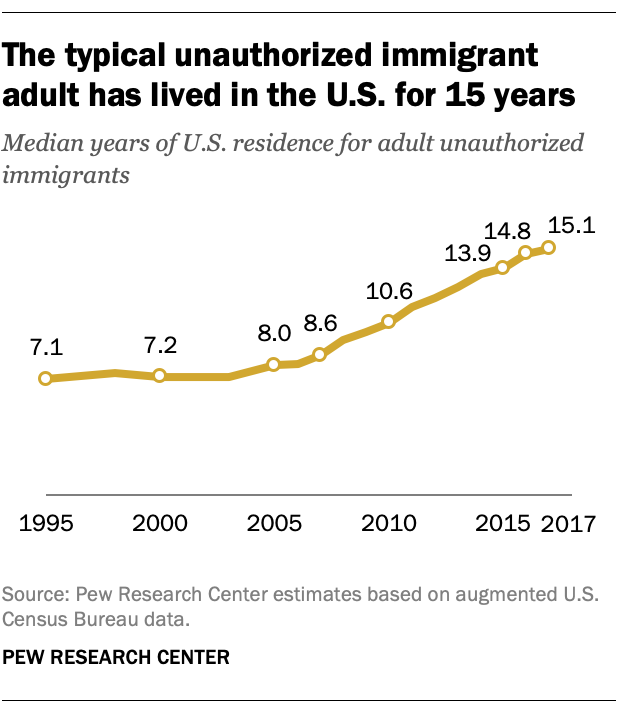 In 2017, the typical unauthorized immigrant adult had lived in the U.S. for 15 years. That is the longest median duration of residence since 1995, when Pew Research Center estimates began.
In 2017, only 20% of unauthorized immigrant adults lived in the U.S. for five years or less, down from 30% a decade earlier. About two-thirds of unauthorized immigrants have been in the U.S. for more than 10 years; a decade earlier, less than half had.
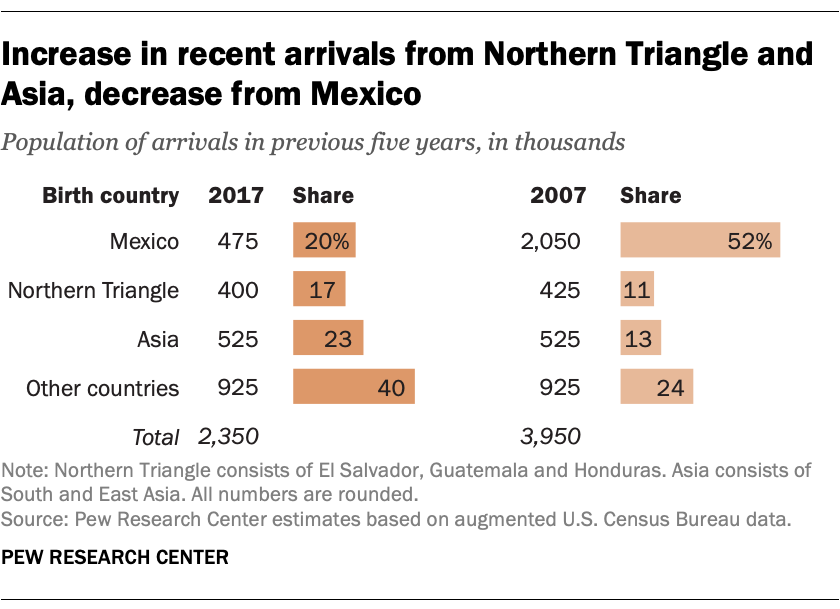
The large drop in new arrivals is almost entirely due to a drop in the number of Mexican unauthorized immigrants coming to the U.S. In 2017, Mexicans accounted for 20% of unauthorized immigrants who came to the U.S. in the previous five years, compared with 52% in 2007. This represents a decrease in the average annual inflow of Mexican unauthorized immigrants, from about 375,000 per year in 2002-2007 to about 90,000 per year for 2012-2017. For other regions of birth, the average annual inflows did not change significantly, but the shares of the total increased due to declining Mexican arrivals.
Fewer unauthorized immigrants in the workforce than a decade ago
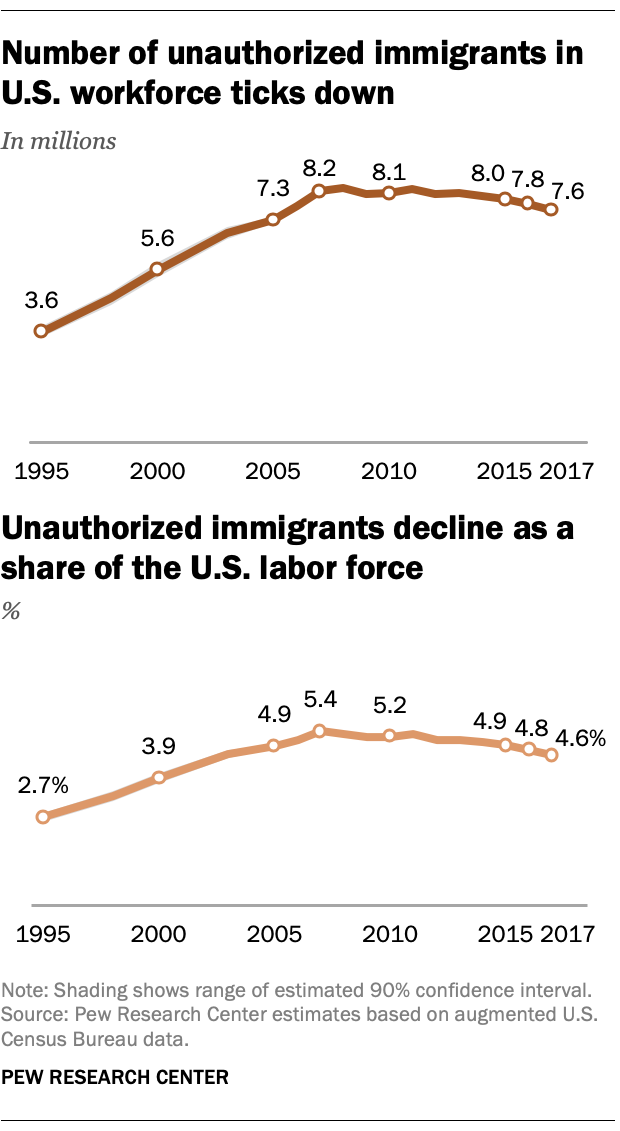 The number of unauthorized immigrants in the labor force working or looking for work declined to 7.6 million in 2017, less than the total of the previous year and notably less than in 2007, when they were 8.2 million.
Unauthorized immigrants made up 4.6% of the labor force in 2017, down from 5.4% in 2007.
https://www.pewresearch.org/fact-tan...pulation-2017/
Additional resources:
Interactive: Unauthorized immigrant population trends for states, birth countries and regions
Video: How we estimate the U.S. unauthorized immigrant populationNO AMNESTY
Don't reward the criminal actions of millions of illegal aliens by giving them citizenship.
Sign in and post comments here.
Please support our fight against illegal immigration by joining ALIPAC's email alerts here https://eepurl.com/cktGTn
-
06-13-2019, 09:38 PM #2Senior Member
- Join Date
- Aug 2008
- Location
- PARADISE (San Diego)
- Posts
- 99,040
NO AMNESTY
Don't reward the criminal actions of millions of illegal aliens by giving them citizenship.
Sign in and post comments here.
Please support our fight against illegal immigration by joining ALIPAC's email alerts here https://eepurl.com/cktGTn


 Reply With Quote
Similar Threads
-
41% of U.S. Counties Experience Population Decline
By JohnDoe2 in forum Other Topics News and IssuesReplies: 9Last Post: 08-27-2019, 09:47 PM -
Rural population in steep decline
By JohnDoe2 in forum Other Topics News and IssuesReplies: 3Last Post: 12-22-2017, 02:21 AM -
Border arrests decline by half
By JohnB2012 in forum illegal immigration News Stories & ReportsReplies: 1Last Post: 07-27-2006, 12:14 AM -
Study: Almost half of Arizona's immigrant population illegal
By Brian503a in forum illegal immigration News Stories & ReportsReplies: 1Last Post: 12-13-2005, 05:39 PM -
Study: Almost half of Arizona's immigrant population illegal
By had_enuf in forum illegal immigration News Stories & ReportsReplies: 0Last Post: 12-12-2005, 09:02 PM


Watch: Paul, Hawley Torch Mayorkas To His Face On Laken Riley's...
04-19-2024, 02:32 PM in illegal immigration News Stories & Reports