

Results 11 to 20 of 23
Thread Information
Users Browsing this Thread
There are currently 1 users browsing this thread. (0 members and 1 guests)
 LinkBack URL
 About LinkBacks
-
11-24-2012, 03:23 PM #11Senior Member


- Join Date
- May 2007
- Location
- South West Florida (Behind friendly lines but still in Occupied Territory)
- Posts
- 117,696
Sep 10, 2012
A Cool-Headed Climate Conversation With Aerospace Legend - Burt Rutan
By Larry Bell, Forbes
My wife Nancy and I recently enjoyed a couple of great days with Burt Rutan and his wife Tonya at their beautiful new home in Coeur dAlene, Idaho. The visit afforded an opportunity to discuss many topics of keenly shared interest, including the global warming debate. Although Burt is world renowned for his remarkable record-setting achievements in aircraft and spacecraft design, he has devoted a great deal of attention to this subject as well.
By way of brief introduction, Burt Rutan designed Voyager, the first aircraft to fly around the globe without stopping or refueling. He also designed SpaceShipOne financed by Microsoft co-founder Paul Allen which won the $10 million Ansari X-Prize in 2004 for becoming the first privately-funded manned craft to enter the realm of space twice within a two-week period. Both, along with three other of his aircraft, are on display at the National Air and Space Museum in Washington, D.C. Burts recent projects include a flying car, and the Virgin GlobalFlyer which broke Voyagers time for a non-stop solo flight around the world.
Burt, as someone with such intense involvement in aerospace design and development, what got you interested in climate issues?
Even though Ive been very busy throughout my entire career developing and flight-testing airplanes for the Air Force, Ive always pursued other research hobbies in my time away from work. Since Im very accustomed to analyzing a lot of data, about three or four years ago many alarmist claims by some climate scientists caught my attention. Since this is such an important topic, I began to look into it firsthand.
Although I have no climate science credentials, I do have considerable expertise in processing and presenting data. I have also had extensive opportunities to observe how other people present data and use it to make their points. There is a rampant tendency in any industry where someone is trying to sell something with a bunch of data, where they cherry pick a little bit...bias a little bit. This becomes quite easy when there is an enormous amount of data to cherry pick from.
The first thing that got my attention, a lot of peoples attention, was statements that the entire planet is heading towards a future climate catastrophe that is attributable to human carbon dioxide emissions. So I decided to take a look at that and just see if this conclusion was arrived at ethically. Its obviously an extremely important issue which has gotten a huge amount of media attention. I was particularly concerned because the proposed solutions will have enormous impacts upon costs of energy, which of course, will increase costs of everything.
Many people seem to get much of their information from what they see in newspapers, with variously biased viewpoints presented in the New York Times, Wall Street Journal, Investors Business Daily, Canadian Free Press, etc. I may be considerably different, in that I always like to look at both sides of things that I take special interest in. So when I decided to look closely at the anthropogenic [man-made] global warming crisis claims, I avoided focusing on media reports, and instead, went directly to available raw climate data. The intent was to see if that data might just as reasonably be interpreted differently.
Then, what really drew me into the subject, was when I found that I couldnt obtain the raw data that I was looking for. I was shocked to find that there were actually climate scientists who wouldnt share the raw data, but would only share their conclusions in summary graphs that were used to prove their various theories about planet warming. In fact I began to smell something really bad, and the worse that smell got, the deeper I looked.
I even read Al Gores book, which was very enlightening...but not in a good way. When you look for data to back up his claims, you immediately discover that they are totally unsubstantiated. This was frankly astonishing because analyzing data is something Im very good at. All my professional life I have been analyzing complex flight test data, interpreting it and presenting it. Something that I always did in flight test is to make a chart that shows every bit of the data, and only then, decide later on the basis of real observed results which parts of the data were valid.
Tragically, policymakers have thrown horrendous amounts of taxpayer money needed for other purposes at solving an unsubstantiated emergency. It is scandalous that so many climate scientists who fully knew that Al Gore had no basis for his irresponsible claims stood mute. Meanwhile, that alarmism has generated billions of dollars more to finance a rapidly growing climate science industry with budgets that have risen by a factor of 40 since the early 1990s. I consider this failure to speak up just as unethical as the behavior of those who put out the false catastrophic claims.
Burt, what was most astonishing to you in the disconnect between what you were seeing in the raw data you were able to obtain and what youre seeing in various report conclusions and in the media?
Well, one of the first things I did was to get out the [U.N. Intergovernmental Panel on Climate Change] IPCC summary for policymakers reports. Inexplicably, the Medieval Warm Period appearing in the first report which was warmer than todays temperatures, disappeared from the second. The last Little Ice Age disappeared as well. They were replaced by the infamous hockey stick graph, which appeared multiple times. That was a big disconnect.
Actually, looking back over the past 11,000 or so years since Earth began to recover from the last big Ice Age, were experiencing a very moderate and stable climate stage. And going back nearly half of the past million years, a long Ice Age occurred about every 90,000 years or so with a large percentage of the planet uninhabitable. Were talking about ice as much as a mile or more thick covering large portions of North America and Europe. Any local warming that alarmists talk about is only a brief and tiny blip.
Theres certainly nothing alarming about the stable period we currently enjoy. I was struck by claims that we are experiencing unprecedented warming caused by Man, where data clearly shows that our recent warming isnt unprecedented. I think thats the main thing that drove me into an obsession to look at this climate subject very closely during my early investigations. I dont do so much nowadays, and hardly did anything last year, but in those early years I spent an enormous amount of time researching data and comparing it with what I was seeing in the IPCC summary reports as products from the alarmists.
Another important thing that caught my attention was that the increased atmospheric CO2 that all this alarmism centers on is of huge benefit for agriculture. Green houses actually supplement CO2 to make plants grow better. It has been shown that crop yields actually go up some 30% or more with doubling of CO2 in the atmosphere. So Im a very confused as to whats wrong with CO2. Its the food plants need to grow and feed all animals, including us.
Im very impressed by all the data that you have made available on charts you prepared for your website. Readers can find that and much more at: www.burtrutan.com
What Im doing really, is just put out all of the data I can in order to enable anyone to look at everything before arriving at a conclusion. If someone forms a conclusion at the onset, they can always find and focus only on data that supports their theory.
I recognize that you feel very strongly about the importance of this topic. What happened when you began to speak publicly about this and let your conclusions be known?
Good question Larry. I first decided to present the results of my study and my data at the Oshkosh Air Show, an event that I have been continuously going to ever since 1971. Of course I have had an enormous following there, and I had always previously spoken on the subject of aircraft development. But on this occasion I thought that the global warming subject was too important not to mention because it was indeed fraudulent. Its effect on Americas competitiveness and economy would be enormous compared to anything else that I have ever seen in my lifetime.
The interesting thing is that I decided to preview this talk for a totally unusual audience, in fact one that would be considered to be opposite of any I normally address. This was on the occasion of receiving a lifetime design achievement award at the Pasadena Art College in July 2009. That was to be a very liberal crowd, mostly college students. The event was about design as it related to what they design in an art college...things like automobiles and motorcycles primarily involving styling rather than dealing with engineering. They had some phenomenal talents for showing beautiful shapes applied to transportation. My designs, which many consider beautiful, are determined by complex flight dynamics and laws of physics.
The transportation design theme attracted Jay Leno to bring one of his very rare cars to the event, a steam-powered vehicle that was absolutely beautiful. Jay sat right in the front row for my presentation. I had previously been on his show twice, appearances related to our SpaceShipOne program. The audience had obviously expected me to present my designs and my philosophy...discuss how I approached creative design. So I did that for maybe five minutes, and then I launched into showing what I have found with my climate hobby. I included chart after chart of data that clearly showed there was fraud and cherry picking bias used by alarmists presenting climate data in order to try to make their point...namely that the Earth faces a catastrophe because of emissions into the atmosphere by Man.
I didnt really know what to expect, because this was the first time I had ever made a public presentation of any of my hobbies. And when I looked out into the audience, what I saw might best be described as stunned silence. I clearly knew that audience was generally liberal, and had assumed that Jay Leno was also. But as soon as I was done, he rushed to the stage, took me off to the side, and told me that he didnt know anything about this, or that the subject was even debatable.
It really surprised me that someone who reaches millions of people every evening could be so totally insulated from any skeptical views on what the alarmists were trying to sell as a future catastrophe. What shocked me most is that I had originally been thinking that the average viewer was at least aware that there are two sides to the issue, rather than almost universally accepting alarmist positions as absolute truth.
But also keep in mind that this was before the East Anglia University Climategate e-mails were released which clearly showed some of the IPCC folks were indeed fraudulent in their science...before there was any way to make a big case that there is a large problem here.
Burt, Im aware that when you joined with many others in signing a letter about this that was published in the Wall Street Journal, you were taken back by the hostile responses directed your way. Can you comment about that experience?
The skeptic community was actually already starting to pay attention to me because they tended to appreciate my large data presentation effort. So I got an e-mail from someone who had rounded up a dozen or so climate scientists that agreed there is no need for alarm regarding catastrophic human-caused global warming to be co-signers, and had gotten approval to have it published in the Wall Street Journal. When asked to join them, I wrote back and said that while I enthusiastically agreed with everything the letter said, I didnt want to sign it because I would be in a group of people who were all climate scientists, and Im not a climate scientist. I finally agreed to allow them to put my name under it only if they made it clear that I am an engineer, not a climate scientist. I still receive a lot of flak from alarmists who challenge how an airplane designer can have the temerity to disagree with their views of science.
Larry, I wasnt really taken back so much by the hostile responses. I expected some of that. But later when I decided to answer some of the more than 150 comments posted at the Scholars and Rogues website, I was surprised that I was often attacked in a very personal way which denigrated my intelligence and accused me of bias. I have no reason to have any bias. Some said I was obviously being paid for by oil companies, which seemed like a joke. If you go through and read my responses you will find that I did so with hard data that alarmists will not publish. But they dont hesitate to publish personal attacks.
So Burt, what are some of the most important points that you wish to emphasize to readers?
One of the most important is to have the general public, the media, and policymakers understand is that any claims that 97%, 98%, or whatever, of all climate scientists agree that our planet is heading for a climate catastrophe are totally bogus. Have humans had any influence on climate? Sure, probably so, although no one has ever succeeded in accurately measuring them. In the absence of everything else, would adding carbon dioxide to the atmosphere have produced some warming? Again, yes. Answering these two questions, and these two questions only, you will see a very large consensus, not only among alarmists, but essentially, every skeptic would also agree.
But none of this presumed warming should be taken to suggest that the results will be catastrophic, causing terribly dangerous things to happen...like serious heat waves and droughts which cause crops to fail...or that when they occur they are unprecedented. It doesnt require anyone with a climate science-related degree to recognize, for example, that 1938 was the warmest year in recent times, and that CO2 levels were much lower then. These consensus issues are discussed in some detail in three PowerPoint charts included near the end of my An Engineers Critique of Global Warming Science report. The bottom line: there is no consensus on the claims of planet catastrophe.
Even prominent former global warming doomsayers, are finally seeing the light of reason. One is my good friend James Lovelock who once said that within the next 50 years or so the few remaining humans will be huddled up in high latitudes to escape the heat of the lower latitudes. He has recently said the alarmists were wrong, and has moved to a new coastal home, unafraid of rising seas.
Sep 07, 2012
SOON AND BRIGGS: Global-warming fanatics take note - Sunspots do impact climate
Dr Willie Soon and Dr. William Briggs
Global-warming fanatics take note - Sunspots do impact climate From the The Washington Times - By Willie Soon and William M. Briggs
Scientists have been studying solar influences on the climate for more than 5,000 years.
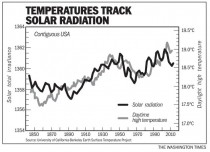
Enlarged
Chinese imperial astronomers kept detailed sunspot records. They noticed that more sunspots meant warmer weather. In 1801, the celebrated astronomer William Herschel (discoverer of the planet Uranus) observed that when there were fewer spots, the price of wheat soared. He surmised that less light and heat from the sun resulted in reduced harvests.
Earlier last month, professor Richard Muller of the University of California-Berkeley Earth Surface Temperature (BEST) project announced that in the projects newly constructed global land temperature record, no component that matches solar activity was related to temperature. Instead, Mr. Muller said carbon dioxide controlled temperature.
Could it really be true that solar radiation - which supplies Earth with the energy that drives our climate and which, when it has varied, has caused the climate to shift over the ages - is no longer the principal influence on climate change?
Consider the accompanying chart. It shows some rather surprising relationships between solar radiation and daytime high temperatures taken directly from Berkeleys BEST project. The remarkable nature of these series is that these tight relationships can be shown to hold from areas as large as the United States.
This new sun-climate relationship picture may be telling us that the way our sun cools and warms the Earth is largely through the penetration of incoming solar radiation in regions with cloudless skies. Recent work by National Center for Atmospheric Research senior scientists Harry van Loon and Gerald Meehl place strong emphasis on this physical point and argue that the use of daytime high temperatures is the most appropriate test of the solar-radiation-surface-temperature connection hypothesis. All previous sun-climate studies have included the complicated nighttime temperature records while the sun is not shining.
Read more: SOON AND BRIGGS: Global-warming fanatics take note - Washington Times
See an older story here.
Sep 02, 2012
Green and democrat war on the poor and middle class
In addition to the declining net worth for the middle class under Obama (4.8% in the last 3 1/2 years up from 2.6 in the Dodd Frank housing bubble recession of 2007-2009) and large increases in health care (my provider already warned of 22-25% increases in 2013), we are about to take a devastating hit from the green agenda (hidden in the first term because of the potential outrage by the low and middle class but promised with a wink and a nod to the greens. These are considered despite the fact these same green policies have proved a dismal failure in Europe and are totally unnecessary as CO2 has little effect on climate and the austerity measures will make absolutely no difference to future climates. If we have a second Obama administration, in 2016, we will look back at 2012 as the good old days. .
----------
By Robert Zubrin
In a nearly full-page op-ed appearing in the business section of the August 25 New York Times, Cornell professor Robert H. Frank lays out the new green agenda for tax policy.
According to Professor Frank, stopping global warming may require carbon taxes of about $300 per ton of carbon dioxide emitted, and by implementing such taxes, we can also balance the federal budget. If such a tax were phased in, Frank says, the prices of goods would rise gradually in proportion to the amount of carbon dioxide their production or use entailed. The price of gasoline, for example, would slowly rise by somewhat less than $3 per gallon. Motorists in many countries already pay that much more than Americans do, and they seem to have adapted by driving substantially more efficient vehicles...many budget experts agree that federal budgets simply cant be balanced with spending cuts alone. Well also need substantial additional revenue, most of which could be generated by a carbon tax.
In addition to increasing the cost of American goods through carbon taxes, Frank recommends jacking up the price of imports through carbon tariffs, and he suggests that the U.S. government use such tariffs to force other nations to impose carbon taxes on their own citizens. Some people argue that a carbon tax would do little good unless it were also adopted by China and other big polluters, Frank says. Its a fair point. But access to the American market is a potent bargaining chip. The United States could seek approval to tax imported goods in proportion to their carbon dioxide emissions if exporting countries failed to enact carbon taxes at home.
Let us consider the effects of this policy. A ton of carbon dioxide contains 248 kilograms of carbon, so a tax of $300 per ton of CO2 would be equivalent to taxing carbon at a rate of $1.21 per kg. Since there are about 2.5 kg of carbon in a gallon of gasoline, this would increase the cost of a gallon of gas by $3.02 per gallon, or just a little more than Frank says. The average American driver uses about 730 gallons of gasoline per year, so this tax would represent a cost of about $2,200 per driver. This would be a serious hit for the average American worker, whose before-tax income is about $45,000 per year, and devastating to those making less than this. But let us consider the effects on the economy as a whole.
The United States economy currently uses about 2.3 trillion kilograms of carbon per year, comprising 1 trillion kg in its coal, 0.8 trillion kg in its oil, and 0.5 trillion kg in its natural gas. Taxing this at Franks recommended rate of $1.21 per kg would therefore raise $2.78 trillion, somewhat more than the $2.3 trillion that the federal government raises through the current tax system (assuming that the carbon tax did not crash the economy, which it probably would, but well leave that aside for now).
But what would the effect on prices be? Currently, western bituminous low-sulfur coal has a cost of $0.01 per kg at the mine, or $0.03 delivered to most users. Coal is about 90 percent carbon by weight. The green tax would thus multiply the cost of coal by nearly a factor of 40. A thousand cubic feet of natural gas contains about 18 kg of carbon. Taxing its carbon at a rate of $1.21 per kg would thus increase the price of a thousand cubic feet of natural gas from its current level of $2.50 to about $24.30, a tenfold increase. A barrel of oil contains about 110 kg of carbon. The green tax would thus hike the price Americans pay for oil by $133 per barrel over the world price (i.e., to about $230 per barrel today). As coal and natural gas provide the energy to produce not only the bulk of the nations electric power, but also most of its steel, aluminum, fertilizer, pesticides, food, plastics, electronics, glass, and many other products, and as oil provides the fuel to transport them, the cost of all of these would soar as well.
So who ends up paying? Under Americas current tax system, the top 5 percent of income earners pay 59 percent of all federal income taxes, the next 45 percent pay 39 percent, and the bottom half pays next to nothing. But because basic commodities such as food, electricity, and fuel are bought in similar amounts per capita regardless of income (i.e., a working-class family living on $30,000 per year in Harlem uses about the same amount of electricity and food as the family of a money manager living on $30 million per year on Park Avenue; and rural Americans, of whatever class, spend much more on gasoline than either), the $2.78 trillion green tax would be spread nearly evenly on all Americans, not as a fixed flat tax percentage of income, but as a fixed cost regardless of income.
Divided evenly among 300 million Americans, the green tax works out to a burden of $9,270 imposed on every man, woman, and child. While this would be a pittance for the most affluent Americans, it would take away 40 percent of the total income of a family of four supported by two wage earners making the average U.S. salary of $45,000 each, and it would be a virtually fatal burden for the poor.
The Obama campaign is currently banging the class-warfare drum, demanding that taxes on those making over $250,000 a year be raised by about 4 percent. Assuming no ill effects on the economy, this measure would raise $80 billion in revenue for the federal government, which conceivably might use as much as half of it, or $40 billion, in various programs that transfer part of their funds to lower-income people. He pays less. You pay more, say the presidents ads, promising largesse to the masses from the pockets of the rich. At the same time, however, green ideologues on whose ideas Obamas energy policies are based are putting forth a proposal that would double the tax burden on the lower-earning 95 percent of the American public, with the poorest 50 percent being hit for a full $1.3 trillion of the increase.
But thats not all. Because the green tax targets carbon, rather than income, it would act as a dirigiste economic policy favoring businesses that make money trading in paper instruments over those that produce real value through industry, agriculture, transport, mining, and construction. This would impoverish society overall, once again hurting the vulnerable the most, and would destroy tens of millions of blue-collar jobs.
Was ever a more regressive tax policy proposed? And has anyone ever demanded that the United States launch a trade war to force other countries to impose such oppressive policies on their own people, most of whom can afford them even less? There was a time when the Democratic party concerned itself with the needs of poor and working people. Alas, those times are past.
The green tax plan is a declaration of war on the poor.
- Dr. Robert Zubrin is president of Pioneer Astronautics, a fellow with the Center for Security Policy, and the author of Energy Victory: Winning the War on Terror by Breaking Free of Oil. His latest book, Merchants of Despair: Radical Environmentalists, Criminal Pseudo-Scientists, and the Fatal Cult of Antihumanism, was recently published by Encounter Books.
ICECAPJoin our efforts to Secure America's Borders and End Illegal Immigration by Joining ALIPAC's E-Mail Alerts network (CLICK HERE)
-
11-24-2012, 03:25 PM #12Senior Member
- Join Date
- May 2007
- Location
- South West Florida (Behind friendly lines but still in Occupied Territory)
- Posts
- 117,696
Sep 02, 2012
Is it Hot?
by Jorg Friedrich - 29.08.2012
Instead of welcoming critical discussion of complex scientific questions, we dismiss climate change skeptics as buffoons.
It was hot in Germany last week, very hot. But were the temperatures really “record-breaking”? Even before the heat wave had reached its apex, newspapers began to pose the question: how high, exactly, must temperatures climb before we can speak of “record heat"=? To find an answer, we must know how high temperatures have climbed in the past - a task that can be surprisingly complicated.
Temperatures are recorded in specific locations, and international guidelines for the recording process are well established. To determine whether a new temperature record has been broken, one must measure the temperature in a given location over a long period of time under stable conditions. One example: in Munster, a city in the Northwest of Germany, the thermometer recorded a temperature of 37.2 degrees Celsius at the city zoo last week, higher than ever before. The problem: during the previous heat wave in the summer of 2003 - when many weather stations in Germany recorded record-breaking measurements – no recordings were taken at that location. The old weather station at the zoo had been closed several years before when a more modern station opened twenty kilometers away at the airport, and the new private weather station didn’t exist yet.
Were temperature records broken or not?
We don’t know. Some scientists believe that the temperature records of the zoo are comparable to records from the airport, but a clear consensus doesn’t exist. The actual temperature in a given location is dependent on many local factors, whose respective influences fluctuate with wind direction, time of day, season, cloud cover, et cetera. To put it simply: it’s impossible to move a thermometer from one location to another one, measure the same temperature at both locations, and conclude that they will always be equally hot or cold.
This simple example points towards a big problem for climate scientists: temperature recordings over time and the calculation of means and trends are highly theoretical constructs that must take into account factors such as changes in measurement technologies, in urban development, and in vegetation near weather stations. The calculation of regional and global mean temperatures adds further complications: despite internationally agreed standards, measures are taken differently in different areas of the globe, and some areas are more densely dotted with weather stations than others.
In the past, scientists often had to rely on tree ring analysis and ice samples from glaciers to determine temperature levels in past centuries. Today, we use electronics and satellite technology to record meteorological parameters.
This shift alone illustrates how much observations must be supplemented by theories to produce nice and orderly temperature records.
Those who remain skeptical of scientists’ warnings of radical climate change often base their doubts on these theoretical constructions. That’s good. Doubt is what separates knowledge from belief. As paradoxical as it may sound, “knowledge” is something that can be doubted.
It’s not unusual that climate change skeptics still exist. What is unusual is that we tend to dismiss their doubts even in light of evident complexities in the reconstruction of past temperatures (which are barely comprehensible to a layman audience) instead of embracing them as the stirrings of enlightened reason, of man as he throws off the shackles of self-inflicted nonage.
Should we really believe grand scientific claims about atmospheric temperature change over the past decade if we cannot even determine whether temperature records were broken in a German city last week? Isn’t it normal to harbor doubts? Why should we believe scientists just like we believed priests in past centuries - as if they had access to secret knowledge, inaccessible to mere mortal.
---------
By the way, see under What’s New and Cool where the heat was followed by cold and even August snow
Aug 30, 2012
Highlights from RNC talks including those not covered on networks
Aug 29, 2012
The Boy Who Cried Warming
Dr. Richard Keen
Pete, I’m forwarding this to some of my favorites, some of whom you’ve no doubt also notified. Great movie, weaving together insights from lots of folks we all know.
best
Rich
___________
From: Pete Garcia [theboywhocriedwarming@gmail.com]
Sent: Wednesday, August 29, 2012 9:50 AM
To: Richard Alan Keen
Subject: Virtual Movie Premiere Invite
Hello Dr. Keen,
It is Pete Garcia II the director / producer / editor of YOUR movie “The Boy Who Cried Warming” the one we interviewed you for at the DDP 2010 in Orlando. Jesse Jones (producer) and I wanted to reach out and inform you that the film was recently completed and virtually launched on our website, August 24th, 2012.
I would like to personally invite you to watch “The Boy Who Cried Warming” in full length at our website.
“Every Global Warming prediction, has proven to be science fiction. Uncover the truth as we expose the shepherds of Climate Change in this new controversial documentary. Introducing first time filmmakers Pete Garcia II (director), Jesse Jones (writer), Deyvis Martinez (dp), Will Rich (sound) in their debut feature length film. Independently funded, this indie documentary in not associated with any corporate sponsorship or funding whatsoever. No hidden agendas, just the COLD truth. Support our grassroots campaign through word of mouth.Help spread the word!”
Please let us know your thoughts on the film, we would love a review, and SPREAD THE WORD! Tell everyone.
Thank you for your time and interview,
Pete Garcia II
Director / Producer
“The Boy Who Cried Warming”
ICECAP
Join our efforts to Secure America's Borders and End Illegal Immigration by Joining ALIPAC's E-Mail Alerts network (CLICK HERE)
-
11-24-2012, 03:27 PM #13Senior Member
- Join Date
- May 2007
- Location
- South West Florida (Behind friendly lines but still in Occupied Territory)
- Posts
- 117,696
Aug 28, 2012AMS Statement on Climate Change
By Judith Curry
The American Meteorological Society (AMS) has just published its new statement on Climate Change.
The statement is billed as an Information Statement of the AMS. This statement is part of the AMS series of Policy Statements, see this link for Guidelines for Statements of the AMS. From the Guidelines:
The American Meteorological Society (AMS) promotes the development and dissemination of information and education on the atmospheric and related oceanic and hydrologic sciences and the advancement of their professional applications.
Information Statements are intended to provide a trustworthy, objective and scientifically up-to- date explanation of scientific issues of concern to the public at large. They are informational only and do not make recommendations or take positions on issues. Information Statements should use language easily understood by a lay reader and avoid technical terminology and jargon. Information statements are typically no longer than 2000 words.
The AMS wrote a previous statement on climate change in 2007 [link].
The link to the new statement can be found here [link].
Excerpts from the statement are appended below, providing a sense of the overall content:
Background
This statement provides a brief overview of how and why global climate has changed over the past century and will continue to change in the future. It is based on the peer-reviewed scientific literature and is consistent with the vast weight of current scientific understanding as expressed in assessments and reports from the Intergovernmental Panel on Climate Change, the U.S. National Academy of Sciences, and the U.S. Global Change Research Program.
How is climate changing?
Warming of the climate system now is unequivocal, according to many different kinds of evidence. Due to natural variability, not every year is warmer than the preceding year globally. Nevertheless, all of the 10 warmest years in the global temperature records up to 2011 have occurred since 1997, with 2005 and 2010 being the warmest two years in more than a century of global records. The warming trend is greatest in northern high latitudes and over land.
Why is climate changing?
Climate is always changing. However, many of the observed changes noted above are beyond what can be explained by the natural variability of the climate. It is clear from extensive scientific evidence that the dominant cause of the rapid change in climate of the past half century is human-induced increases in the amount of atmospheric greenhouse gases, including carbon dioxide (CO2), chlorofluorocarbons, methane, and nitrous oxide. The most important of these over the long term is CO2, whose concentration in the atmosphere is rising principally as a result of fossil-fuel combustion and deforestation.
Human activity also affects climate through changes in the number and physical properties of tiny solid particles and liquid droplets in the atmosphere, known collectively as atmospheric aerosols. Examples of aerosols include dust, sea salt, and sulfates from air pollution.
Land surface changes can also affect the surface exchanges of water and energy with the atmosphere. Humans alter land surface characteristics by carrying out irrigation, removing and introducing forests, changing vegetative land cover through agriculture, and building cities and reservoirs. These changes can have significant effects on local-to-regional climate patterns, which adds up to a small impact on the global energy balance as well.
How is the climate expected to change in the future?
Future warming of the climate is inevitable for many years due to the greenhouse gases already added to the atmosphere and the heat that has been taken up by the oceans.
In general, many of the climate-system trends observed in recent decades are projected to continue. Those projections, and others in this section, are largely based on simulations conducted with climate models, and assume that the amount of greenhouse gas in the atmosphere will continue to increase due to human activity. Global efforts to slow greenhouse gas emissions have been unsuccessful so far. However, were future technologies and policies able to achieve a rapid reduction of greenhouse gas emissions - an approach termed mitigation - this would greatly lessen future global warming and its impacts.
Confidence in the projections is higher for temperature than for other climate elements such as precipitation, and higher at the global and continental scales than for the regional and local scales. The model projections show that the largest warming will occur in northern polar regions, over land areas, and in the winter season, consistent with observed trends.
In the 21st century, global sea level also will continue to rise although the rise will not be uniform at all locations. With its large mass and high capacity for heat storage, the ocean will continue to slowly warm and thus thermally expand for several centuries. Model simulations project about 27 cm (10 inches) to 71 cm (28 inches) of global sea level rise due to thermal expansion and melting of ice in the 21st century. Moreover, paleoclimatic observations and ice-sheet modeling indicate that melting of the Greenland and the West Antarctic ice sheets will eventually cause global sea level to rise several additional meters by 2500 if warming continues at its present rate beyond the 21st century.
Atmospheric water content will increase globally, consistent with warmer temperatures, and consequently the global hydrological cycle will continue to accelerate. For many areas, model simulations suggest there will be a tendency towards more intense rain and snow events separated by longer periods without precipitation. However, changes in precipitation patterns are expected to differ considerably by region and by season. In some regions, the accelerated hydrological cycle will likely reinforce existing patterns of precipitation, leading to more severe droughts and floods. Further poleward, the greater warming at high latitudes and over land likely will change the large-scale atmospheric circulation, leading to significant regional shifts in precipitation patterns. For example, the model simulations suggest that precipitation will increase in the far northern parts of North America, and decrease in the southwest and south-central United States where more droughts will occur.
Climate-model simulations further project that heavy precipitation events will continue to become more intense and frequent, leading to increased precipitation totals from the strongest storms. This projection has important implications for water-resource management and flood control. The simulations also indicate the likelihood of longer dry spells between precipitation events in the subtropics and lower-middle latitudes, with shorter dry spells projected for higher latitudes where mean precipitation is expected to increase. Continued warming also implies a reduction of winter snow accumulations in favor of rain in many places, and thus a reduced spring snowpack. Rivers now fed by snowmelt will experience earlier spring peaks and reduced warm-season flows. Widespread retreat of mountain glaciers is expected to eventually lead to reduced dry season flows for glacier-fed rivers. Drought is projected to increase over Africa, Europe, and much of the North American continental interior, and particularly the southwest United States. However, natural variations in world ocean conditions at decadal scale, such as those in the North Pacific and North Atlantic basins, could offset or enhance such changes in the next few decades. For the longer term, paleoclimatic observations suggest that droughts lasting decades are possible and that these prolonged droughts could occur with little warning.
Weather patterns will continue to vary from day to day and from season to season, but the frequency of particular patterns and extreme weather and climate events may change as a result of global warming. Model simulations project an increased proportion of global hurricanes that are in the strongest categories, namely 4 and 5 on the Saffir-Simpson scale, although the total counts of hurricanes may not change or may even decrease. Some regional variations in these trends are possible. Simulations also indicate that midlatitude storm tracks will shift poleward. Interannual variations of important large-scale climate conditions (such as El Nino and La Nina) will also continue to occur, but there may be changes in their intensity, frequency, and other characteristics, resulting in different responses by the atmosphere. Heat waves and cold snaps and their associated weather conditions will continue to occur, but proportionately more extreme warm periods and fewer cold periods are expected. Indeed, what many people traditionally consider a cold wave is already changing toward less severe conditions. Frost days (those with minimum temperature below freezing) will be fewer and growing seasons longer. Drier conditions in summer, such as those anticipated for the southern United States and southern Europe, are expected to contribute to more severe episodes of extreme heat. Critical thresholds of daily maximum temperature, above which ecosystems and crop systems (e.g., food crops such as rice, corn, and wheat) suffer increasingly severe damage, are likely to be exceeded more frequently.
Final remarks
There is unequivocal evidence that Earths lower atmosphere, ocean, and land surface are warming; sea level is rising; and snow cover, mountain glaciers, and Arctic sea ice are shrinking. The dominant cause of the warming since the 1950s is human activities. This scientific finding is based on a large and persuasive body of research. The observed warming will be irreversible for many years into the future, and even larger temperature increases will occur as greenhouse gases continue to accumulate in the atmosphere. Avoiding this future warming will require a large and rapid reduction in global greenhouse gas emissions. The ongoing warming will increase risks and stresses to human societies, economies, ecosystems, and wildlife through the 21st century and beyond, making it imperative that society respond to a changing climate. To inform decisions on adaptation and mitigation, it is critical that we improve our understanding of the global climate system and our ability to project future climate through continued and improved monitoring and research. This is especially true for smaller (seasonal and regional) scales and weather and climate extremes, and for important hydroclimatic variables such as precipitation and water availability.
Technological, economic, and policy choices in the near future will determine the extent of future impacts of climate change. Science-based decisions are seldom made in a context of absolute certainty. National and international policy discussions should include consideration of the best ways to both adapt to and mitigate climate change. Mitigation will reduce the amount of future climate change and the risk of impacts that are potentially large and dangerous. At the same time, some continued climate change is inevitable, and policy responses should include adaptation to climate change. Prudence dictates extreme care in accounting for our relationship with the only planet known to be capable of sustaining human life.
[This statement is considered in force until August 2017 unless superseded by a new statement issued by the AMS Council before this date.]
Update: Bill Hooke has some additional background on the AMS statement:
JC comments:
My strong objections to this type of statement by professional societies has been voiced previously. This statement is worse than the previous AMS statement, and much worse than the statement by the Royal Society, which is probably the most credible statement on this topic made by a professional society.
So who is responsible for this statement? Current members of the AMS Council can be found [here]. It is not clear who authored the statement, but I suspect it was the members of the AMS Committee on Climate Variability and Change (for membership list, see here). After reading this list of names, I recognize some, but less than half. Does this group of people inspire my confidence in making an assessment of climate change? In a word, NO.
Several months ago, I recall receiving an email asking for comments on the draft statement (apparently a mass mailing to the AMS membership). I tried to access it but didnt have my site login info handy at the time. So I am seeing this statement today for the first time. I suspect that there will be a lot of AMS members that are unhappy with this statement.
Apart from the broader issue of whether or not professional societies should make such statements, the main question that I have is why write a new statement now? It appears that each statement has a life time of 5 years. Why not wait another year or two until the IPCC AR5 is out? It seems that there is little in the AMS statement that is associated with more recent publications (since the AR4). As the CMIP5 climate model simulations show a broader range of uncertainty than the simulations used in the AR4, what is the basis for making a more confident statement on attribution (which seems to be based wholly on models) than was made in the AR4?
As far as I can tell, this statement is a naive example of Michael Kellys invisible hand (quote from my no consensus paper):
Kelly (2005) describes an additional source of confirmation bias in the consensus building process: As more and more peers weigh in on a given issue, the proportion of the total evidence which consists of higher order psychological evidence [of what other people believe] increases, and the proportion of the total evidence which consists of first order evidence decreases . . . At some point, when the number of peers grows large enough, the higher order psychological evidence will swamp the first order evidence into virtual insignificance.
In other words, consensus statements get parroted without any actual intellectual examination. In this case, what is the point of the AMS statement? Apparently, to inform the public on this controversial issue by appealing to the authority of the society.
JC note to AMS: read my paper No consensus on consensus.
Aug 27, 2012
Pay no attention to global-warming alarmists
With this newspaper arguing that our planet is in peril and that its remedies should be followed, global warming has again arisen as a hot political and pseudo-religious topic. Even professors from the University of Kentucky bear witness to their faith, professors who should know that science has nothing to do with faith or claims of consensus. Objective science is about logic and evidence only.
Albert Einstein understood this when his Theory of Relativity turned the classical physics world upside-down in 1905. He patiently waited decades for experimental confirmation, emphasizing that one man can prove me wrong. What a contrast with global warming, where proponents offer popularity, authority and peer-review as definitive substitutes for real science.
What do we mean by global warming? It is not climate change, climate disruption or whatever truism propagandists invent. We mean the theory that man-made carbon dioxide is catastrophically warming the Earth.
Nobel Laureate in physics Ivar Giaever says that the tiny observed increase of 0.8 degree Centigrade over the 20th century indicates remarkable stability and no cause for alarm.
Meteorologist and staunch Democrat Martin Hertzberg points out that we experimented with carbon reduction schemes in the 1930s. These reduced fossil fuel usage by 20 percent and went by the memorable name Great Depression. Mother Nature had the last laugh as temperatures and CO2 levels continued upward, proving that man is not as important as he thinks.
After World War II, the post-war boom saw an expansion of human CO2 emissions but a decline in the global temperature. After the Great Pacific Climate Shift of 1977, when the Pacific Ocean shifted to its warm phase, we finally saw temperatures rise in concert with man-made CO2.
What has especially confused climate alarmists has been the abrupt cessation of warming since 1998, as shown by NASA satellite measurements, the best global temperature measurements we have.
For advocates to prove that increasing carbon dioxide has any effect on temperature, they need to find a unique signature that would be expected only from carbon dioxide and not from ocean or solar cycles.
The notorious climate codes which erroneously forecast rapidly rising temperatures predict such a signature developing in the tropical troposphere. But the hot spot is not observed. This says that late 20th-century warming had at most a small greenhouse gas component.
Because the high quality temperature reconstructions from polar ice cores show far greater temperature variations in the past than seen recently, there is no way a rational person can argue that anything unusual is happening today. Previous warm periods (Minoan, Roman and Medieval) were all warmer than today and ramped up in similar fashion.
During this Holocene interglacial period, the overall temperature trend has been downward as the Earths closest approach to the Sun has shifted from the Northern to Southern Hemisphere summer over 10,000 years. This is part of the Milankovitch Cycles known to dominate the Earths climate for at least the last half million years.
The enormous shift of 85 watts/m2 of sunlight from July to January is what brings us to the brink of another Ice Age. But dont trade your swimsuit for a heavy winter parka just yet, because our oceans contain the vast majority of mobile heat on this planet and will prevent a precipitous plunge into another Ice Age.
With ocean cycles now negative or heading negative, and with the abrupt decrease in solar activity reminiscent of the cold Maunder Minimum of the 17th century, a cooler future appears inevitable.
The expected cooling should slow or slightly reverse in 50 to 100 years, according to Habibullo Abdussamatov, a top Russian astrophysicist. However another warm period happens only once every 1,000-plus years. If we plunge into an ice age first, you will have to wait about 100,000 years. Massive ice sheets reach south of Indianapolis during ice ages.
Will carbon-dioxide warming save us? Harvard-Smithsonian astrophysicist Willie Soon gives a blunt answer: Its the sun, stupid.
While Kentuckians may seek supernatural explanations for their brutal summer weather, they should realize that many did not see a hot June and July. We in the Pacific Northwest and many in Europe were complaining of unusual cold.
The ancient Egyptians had it right 3,500 years before the dawn of modern science. The primary Climate God is Amon Ra, the God of the Sun. The God of Carbon Dioxide, Al Gore, is but a minor contender.
Aug 24, 2012
AGU: Link found between cold European winters and solar activity
From the American Geophysical Union
WASHINGTON - Scientists have long suspected that the Suns 11-year cycle influences climate of certain regions on Earth. Yet records of average, seasonal temperatures do not date back far enough to confirm any patterns. Now, armed with a unique proxy, an international team of researchers show that unusually cold winters in Central Europe are related to low solar activity - when sunspot numbers are minimal. The freezing of Germanys largest river, the Rhine, is the key.
Although the Earths surface overall continues to warm, the new analysis has revealed a correlation between periods of low activity of the Sun and of some cooling - on a limited, regional scale in Central Europe, along the Rhine.
The advantage with studying the Rhine is because its a very simple measurement, said Frank Sirocko lead author of a paper on the study and professor of Sedimentology and Paleoclimatology at the Institute of Geosciences of Johannes Gutenberg University in Mainz, Germany. Freezing is special in that its like an on-off mode. Either there is ice or there is no ice.
From the early 19th through mid-20th centuries, riverboat men used the Rhine for cargo transport. And so docks along the river have annual records of when ice clogged the waterway and stymied shipping. The scientists used these easily-accessible documents, as well as additional historical accounts, to determine the number of freezing episodes since 1780.
Sirocko and his colleagues found that between 1780 and 1963, the Rhine froze in multiple places 14 different times. The sheer size of the river means it takes extremely cold temperatures to freeze over making freezing episodes a good proxy for very cold winters in the region, Sirocko said.
Mapping the freezing episodes against the solar activitys 11-year cycle - a cycle of the Suns varying magnetic strength and thus total radiation output - Sirocko and his colleagues determined that ten of the fourteen freezes occurred during years around when the Sun had minimal sunspots. Using statistical methods, the scientists calculated that there is a 99 percent chance that extremely cold Central European winters and low solar activity are inherently linked.
We provide, for the first time, statistically robust evidence that the succession of cold winters during the last 230 years in Central Europe has a common cause, Sirocko said.
With the new paper, Sirocko and his colleagues have added to the research linking solar variability with climate, said Thomas Crowley, Director of the Scottish Alliance for Geoscience, Environment, and Society, who was not involved with the study.
There is some suspension of belief in this link, Crowley said, and this study tilts the argument more towards thinking there really is something to this link. If you have more statistical evidence to support this explanation, one is more likely to say its true.
The study, conducted by researchers at Johannes Gutenberg and the Institute for Atmospheric and Climate Science in Zurich, Switzerland, is set to be published August 25 in Geophysical Research Letters, a journal of the American Geophysical Union.
When sunspot numbers are down, the Sun emits less ultraviolet radiation. Less radiation means less heating of Earths atmosphere, which sparks a change in the circulation patterns of the two lowest atmospheric levels, the troposphere and stratosphere. Such changes lead to climatic phenomena such as the North Atlantic Oscillation, a pattern of atmospheric pressure variations that influences wind patterns in the North Atlantic and weather behavior in regions in and around Europe.
Due to this indirect effect, the solar cycle does not impact hemispherically averaged temperatures, but only leads to regional temperature anomalies, said Stephan Pfahl, a co-author of the study who is now at the Institute for Atmospheric and Climate Science in Zurich.
The authors show that this change in atmospheric circulation leads to cooling in parts of Central Europe but warming in other European countries, such as Iceland. So, sunspots dont necessarily cool the entire globe - their cooling effect is more localized, Sirocko said.
In fact, studies have suggested that the extremely cold European winters of 2010 and 2011 were the result of the North Atlantic Oscillation, which Sirocko and his team now link to the low solar activity during that time.
The 2010 and 2011 European winters were so cold that they resulted in record lows for the month of November in certain countries. Some who dispute the occurrence of anthropogenic climate change argue that this two-year period shows that Earths climate is not getting any warmer. But climate is a complex system, Sirocko said. And a short-term, localized dip in temperatures only temporarily masks the effects of a warming world.
Climate is not ruled by one variable, said Sirocko. In fact, it has [at least] five or six variables. Carbon dioxide is certainly one, but solar activity is also one.
Moreover, the researchers also point out that, despite Central Europes prospect to suffer colder winters every 11 years or so, the average temperature of those winters is increasing and has been for the past three decades. As one piece of evidence of that warming, the Rhine River has not frozen over since 1963. Sirocko said such warming results, in part, from climate change.
To establish a more complete record of past temperature dips, the researchers are looking to other proxies, such as the spread of disease and migratory habits.
Disease can be transported by insects and rats, but during a strong freezing year that is not likely, said Sirocko. Also, Romans used the Rhine to defend against the Germanics, but as soon as the river froze people could move across it. The freezing of the Rhine is very important on historical timescales.
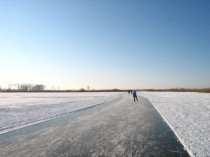
It wasnt, however, the Rhine that first got Sirocko to thinking about the connection between freezing rivers and sunspot activity. In fact, it was a 125-mile ice-skating race he attended over 20 years ago in the Netherlands that sparked the scientists idea.
Skaters can only do this race every 10 or 11 years because thats when the rivers freeze up, Sirocko said. I thought to myself, There must be a reason for this, and it turns out there is.
Title:
Solar influence on winter severity in central Europe
Abstract:
The last two winters in central Europe were unusually cold in comparison to the years before. Meteorological data, mainly from the last 50 years, and modelling studies have suggested that both solar activity and El Niño strength may influence such central European winter coldness. To investigate the mechanisms behind this in a statistically robust way and to test which of the two factors was more important during the last 230 years back into the Little Ice Age, we use historical reports of freezing of the river Rhine. The historical data show that 10 of the 14 freeze years occurred close to sunspot minima and only one during a year of moderate El Niño. This solar influence is underpinned by corresponding atmospheric circulation anomalies in reanalysis data covering the period 1871 to 2008. Accordingly, weak solar activity is empirically related to extremely cold winter conditions in Europe also on such long time scales. This relationship still holds today, however the average winter temperatures have been rising during the last decades.
Authors:
Frank Sirocko and Heiko Brunck: Institute of Geosciences, Johannes Gutenberg University Mainz;
Stephan Pfahl: Institute for Atmospheric and Climate Science, ETH Zurich, Switzerland
=======
UPDATE: Dr. Leif Svalgaard provides the paper, as did the AGU press agent Kate Ramsayer per my emailed request, along with a copyright admonishment. Thank you both. Figure 6a and 6b are interesting:
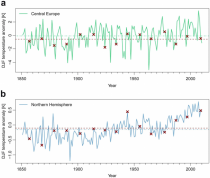
Enlarged.
ICECAP
Join our efforts to Secure America's Borders and End Illegal Immigration by Joining ALIPAC's E-Mail Alerts network (CLICK HERE)
-
11-24-2012, 03:29 PM #14Senior Member
- Join Date
- May 2007
- Location
- South West Florida (Behind friendly lines but still in Occupied Territory)
- Posts
- 117,696
Aug 22, 2012
DC Circuit Tosses Out EPA’s Pollution Rule - TWO THUMBS UP
Amidst Obama’s inexorable war on American energy, consumers, jobs, and prosperity, his EPA is in the process of promulgating 4 new pollution rules that will bury the coal industry and “necessarily” raise the price of electricity on American households. They are the Cross-State Air Pollution Rule, the Mercury and Air Toxics Standards for Utilities (MACT), the Cooling Water Intake Structures regulation, and the Disposal of Coal Combustion residuals. The former two have already been finalized while the latter two are close behind. Today, the D.C. Circuit Court struck down the EPA’s authority to implement the Cross-State Air Pollution Rule.
In August 2011, Obama’s EPA imposed a cap and trade style program to expand existing limitations on sulfur dioxide and nitrogen oxide emissions from coal-fired power plants in 28 “upwind” states. They claimed that they had unlimited authority pursuant to the Clean Air Act to cap emissions that supposedly travel across state lines. The EPA admitted that the rule would cost $2.7 billion from the private sector and force many cole-fired power plants to shut down. Priorities USA might have even run an ad against Obama claiming that his superfluous regulations cause workers to lose their health insurance and die.
Luckily, several southern states decided to sue the EPA in federal court. In EME HOMER CITY GENERATION, L.P. v. EPA, the D.C. Circuit Court of Appeals ruled 2-1 that the EPA had exceeded its authority under the Clean Air Act in two respects:
First, the statutory text grants EPA authority to require upwind States to reduce only their own significant contributions to a downwind State’s nonattainment. But under the Transport Rule, upwind States may be required to reduce emissions by more than their own significant contributions to a downwind State’s nonattainment. EPA has used the good neighbor provision to impose massive emissions reduction requirements on upwind States without regard to the limits imposed by the statutory text. Whatever its merits as a policy matter, EPA’s Transport Rule violates the statute. Second, the Clean Air Act affords States the initial opportunity to implement reductions required by EPA under the good neighbor provision. But here, when EPA quantified States’ good neighbor obligations, it did not allow the States the initial opportunity to implement the required reductions with respect to sources within their borders. Instead, EPA quantified States’ good neighbor obligations and simultaneously set forth EPA-designed Federal Implementation Plans, or FIPs, to implement those obligations at the State level. By doing so, EPA departed from its consistent prior approach to implementing the good neighbor provision and violated the Act.Judge Brett Kavanaugh, who wrote the majority opinion, created more jobs with that decision that Obama did throughout his tenure.
While this is definitely a big victory, and underscores the importance of putting conservatives on the DC Circuit Court (which has original jurisdiction over many federal policy issues), we still need to continue a robust legislative assault against these cap and trade style regulations. The Clean Air Act and Clean Water Act still serve as an albatross around the necks of job creators and can still be used to justify many of the impending regulations, even after the court’s decision.
When Republicans take back control of government, they must move to roll back most federal involvement in regulation of pollution. With the states more than happy to pick up the slack, especially the blue states, federal involvement in this regulatory scheme can only be harmful. Rules and regulations that could potentially affect the lifeline of local economies must only be debated and implemented on a local level.
--------------------
Listen to this excellent interview with meteorologist Anthony Sadar, CCM, Air Pollution Meteorologist (In Global Warming We Trust, a Heretics Guide)
Perspective of a Lifetime on Atmospheric Modeling
By Anthony J. Sadar
The president vowed to make climate change a top priority in his second term, suggesting that a major assault on industry is coming if he is re-elected. So before the potential onslaught, some real-world perspective on climate change is essential.
First, note that the tool used to both develop future global climate scenarios and to panic the public on meteorological mayhem is atmospheric modeling.
Most of my nearly 35 years of professional life has been involved with atmospheric modeling in one way or another. I began my scientific career in meteorology in the late ‘70s. Back then, calculating air quality impacts of air pollution sources, such as smokestacks and vents, involved using a simple statistical calculator and some basic graphs derived from empirical studies—a rudimentary form of modeling.
Over the years, with more powerful computers and sophisticated graphics, air pollution meteorologists, like me, were able to analyze in more depth and with finer detail contaminant concentrations as they spread from their emission locations.
Today, air-quality models are coupled with some of the very same meteorological models used in climate studies. In this way, state-of-the-science estimates can be made to determine whether, for instance, a proposed industrial facility will contribute to unacceptable deterioration of air quality.
Air pollution models have long been used to evaluate just about any significant operation from the smallest chemical plant to the largest nuclear or coal-fired power plant. Furthermore, the models are useful in anticipating the consequences of mundane releases of contaminants to catastrophic outbursts from accidents or terrorist attacks that disperse gases or particles like chlorine dioxide or anthrax.
What I and so many other air modelers have discovered is that, as impressive as modeling has become, model results beyond the immediate downwind distance of the pollution source and within a relatively brief amount of time, are not very reliable, despite the awesome computing power available today. We know that dependence on their output is quite limited and to extrapolate too far beyond the bounds of the model assumptions is foolhardy.
Compare the experience of thousands of non-academic air modelers with the largely academic and government climate modelers. Their combined efforts have produced impressive results in scope and scale, yet, like air pollution modeling, their model outputs for long-term global climate conditions still boil down to limited guesses.
Regardless, a bit of understanding about the global atmosphere has been spun into a trillion-dollar bonanza by a colaition of supporters. These cheerleaders take the form of career politicians, bureaucrats, environmental and social activists, academics and educators, technologists and consultants, journalists, bloggers, and groupies of all stripes.
But realism and humility about the limitations of climate modeling must set in soon with enough scientists and those of the general public who care enough to pay attention. Let’s face it: if Mr. Obama gets his way in November, then more than our supposed climate future with be in dire straits.
Meteorologist Anthony J. Sadar is the author of In Global Warming We Trust: A Heretic’s Guide to Climate Science (Telescope Books: Telescope Books).
Aug 19, 2012
Real energy for a new American renaissance
Sensible, responsible energy policies must replace today’s subsidies and crony corporatism
By Paul Driessen
America needs more economic growth, domestic manufacturing, jobs and secure, affordable energy to make those things happen.
Presidential candidate Mitt Romney understands that achieving this goal requires unleashing American ingenuity, reducing excessive regulatory strangleholds on businesses and working capital, and allowing safe, proven technologies to tap and utilize our vast onshore and offshore deposits of oil, natural gas and other energy riches. He knows we can do all this without sacrificing important environmental values.
President Obama fervently believes the solution is to unleash more taxes, regulations and regulators, keep our subsurface resources off limits, and impose a painful transition from hydrocarbons to wind, solar and biofuel energy. He aligns with and listens to environmentalist agitators who detest hydrocarbons, frighten people into thinking fossil fuel production and use will destroy the planet, and conceal the
adverse health, economic and environmental effects of “green” energy “alternatives.”
The Obama vision has been an unmitigated disaster. Countless failures, bankruptcies and layoffs are matched by a need for perpetual subsidies taken from hard-working, productive people and businesses, and given by unaccountable bureaucrats to failed technologies and companies, run by crony corporatists who return the favor by contributing substantial portions of our compulsory taxpayer largesse to the reelection campaigns of cooperative politicians.
The Romney vision, by contrast, actually works. Bain Capital investments brought us Staples, The Sports Authority, Steel Dynamics and many other success stories. More recently, on the energy front, America’s private sector ingenuity, sweat and perseverance launched new technologies and discoveries that abruptly ended the myths of “peak oil” and “imminent depletion” of US and global petroleum.
Horizontal drilling and hydraulic fracturing, for example, was developed by private industry, funded by private investors and tested on private lands. It did not have to depend on taxpayer subsidies, approval by federal bureaucrats, or access to shale deposits on federal lands.
Had it been otherwise, “fracking” would never have gotten off the ground. The incredible North Dakota, Texas and Pennsylvania oil, gas, jobs and revenue boom would never have occurred. Vast deposits of oil, natural gas and natural gas liquids would have remained trapped in shale rock formations, thousands of feet below Earth’s surface.
Natural gas prices would still be above $8 per thousand cubic feet (million Btu), instead of in the $2.50 to $3.00 range. America would still be looking overseas for fuels to replace the coal that the Obama EPA is effectively eliminating from our energy, electricity, employment and economic picture.
But thanks to drilling and fracking on private lands, under commonsense state regulations, US oil and gas production is increasing, for the first time in 15 years, despite continued leasing and drilling moratoria on federal onshore and offshore lands. America is on the threshold of a manufacturing renaissance fueled largely by access to abundant, reliable, affordable fuels and petrochemical feed stocks, to power and supply raw materials for factories, refineries and chemical plants.
Plentiful gas from the Marcellus shale formation has persuaded Shell to plan a $2biillion ethane “cracking” plant near Pittsburgh creating 10,000 construction jobs and 10,000 permanent jobs. Steel plants, electric utilities and countless other industries will also benefit from shale gas.
Citigroup’s “Energy 2020” report says the US petroleum industry could add “as many as 3.6 million jobs by 2020 and increase the US gross domestic product by as much as 3 percent,” while also generating billions of dollars in lease bonuses, rents, royalties and taxes for local, state and federal governments.
Fracking could bring new jobs and revenues to depressed areas of Maryland, New York, Ohio and other states. Expanded access to our newfound century’s worth of hydrocarbon energy will keep prices low and reverse the flow of manufacturing jobs out of our country, providing jobs for millions of American graduates and unemployed workers, and creating a new prosperity for current and future generations.
Moreover, the energy, manufacturing, employment and economic benefits will be unencumbered by worrisome environmental impacts. Hydraulic fracturing has been utilized since 1949, and has been carried out more than 2.5 million times, safely and without causing any serious harm.
Fracking fluids are 99.5% water and sand, combined with chemicals that keep sand particles suspended in the liquid, fight bacterial growth, and improve gas flow and production. Most additives used today are vegetable oils and common, biodegradable chemicals found in cheese, beer, canned fish, dairy desserts, shampoo, and other food and cosmetic products. Steadily improving technologies, techniques and regulations will further reduce environmental risks.
For those still worried about catastrophic manmade global warming, natural gas emits far less carbon dioxide than coal. It doesn’t create waste disposal or radiation disinformation that has stymied nuclear power expansion. Unlike wind turbines, it doesn’t slaughter birds and bats. Unlike solar power, it doesn’t require blanketing millions of acres of wildlife habitat with photovoltaic panels.
Unfortunately, facts like these have not stopped peak oil diehards and anti-hydrocarbon activists in and out of the Obama administration. They have become master fear mongers and propagandists, advancing their “just say no” opposition to North American fossil fuel energy and using lawsuits, lobbying, fabrications and demonstrations to block drilling, fracking, the Keystone XL pipeline, coal mining and burning, and countless other projects, while promoting subsidies, favoritism, and exemptions from environmental laws for wind, solar and biofuel programs.
During his first inaugural address, in the depths of the Great Depression, President Franklin Roosevelt told the American people, “the only thing we have to fear is fear itself, nameless, unreasoning, unjustified terror which paralyzes needed efforts to convert retreat into advance.”
Environmental extremists take the opposite tack, arguing that the only thing we have to fear is… just about everything.
We need jobs and renewed economic vitality. We all want a clean environment. Since the first Earth Day in 1970, industries of all kinds have made tremendous progress in reducing emissions and improving safety, efficiency and sustainability. They will doubtless continue to make further progress.
But giving in to fear and hysteria, and throwing more roadblocks in front of responsible energy and economic development, creates far more harm than benefit for our nation and its people.
Team Obama is the government arm of the environmental extremist lobby. It’s time to replace it with a Romney team that understands, encourages and enables sensible, responsible North American energy and economic development.
--------
Paul Driessen is senior policy advisor for the Committee For A Constructive Tomorrow (CFACT -) and author of Eco-Imperialism: Green power Black death.
Aug 15, 2012
‘Climate Consensus’ Data Need a More Careful Look
In his Aug. 6 op-ed, “A New Climate-Change Consensus,” Environmental Defense Fund President Fred Krupp speaks of “the trend- a decades -long march toward hotter and wilder weather.” We have seen quite a few such claims this summer season, and Mr. Krupp insists that we accept them as “true.” Only with Lewis Carroll’s famous definition of truth, “What I tell you three times is true,” is this the case.
But repetition of a fib does not make it true. As one of many pieces of evidence that our climate is doing what it always does, consider the National Oceanic and Atmospheric Administration’s year-by-year data for wet and dry years in the continental U.S.
From 1900 to the present, there are only irregular, chaotic variations from year to year, but no change in the trend or in the frequency of dry years or wet years. Sometimes there are clusters of dry years, the most significant being the dry Dust Bowl years of the 1930s. These tend to be followed by clusters of wet years.
Despite shrill claims of new record highs, when we look at record highs for temperature measurement stations that have existed long enough to have a meaningful history, there is no trend in the number of extreme high temperatures, neither regionally nor continentally. We do see the Dust Bowl years of the 1930s setting the largest number of record highs, at a time when it is acknowledged that humans had negligible effect on climate.
What about strong tornadoes? Again there is no trend. Last year was an unusually active season, and unfortunately some of those storms ravaged population centers. We were told that these disasters were the result of human CO2 emissions. Yet 2011 was only the sixth worst for strong tornadoes since 1950 and far from a record. And have any of us heard about this tornado year? Why not? Because 2012 has been unusually quiet. Most of the tornado season is behind us, and so far the tornado count is mired in the lowest quintile of historical activity. As for hurricanes, again there is no discernible trend.
Regarding wildfires, past western fires burned far more acreage than today. Any climate effect on wildfires is complicated by the controversial fire suppression practices of the past hundred years.
Lurid media reporting and advocates’ claims aside, even the last comprehensive Intergovernmental Panel on Climate Change report noted that"archived data sets are not yet sufficient for determining long-term trends in [weather] extremes.” Yet this has not stopped global warming advocates from using hot summer weather as a tool to dramatize a supposedly impending climate Armageddon.
In a telling 2007 PBS interview, former Sen. Tim Wirth gloated about how he had rigged the 1988 Senate testimony chamber to dramatize the impact of NASA scientist James Hansen’s histrionic testimony on imminent danger from global warming: “We called the Weather Bureau and found out what historically was the hottest day of the summer...So we scheduled the
hearing that day, and bingo, it was the hottest day on record in Washington or close to it.”
Not content to gamble on the vagaries of weather statistics, Mr. Wirth also boasted, “What we did is that we went in the night beforehand and opened all the windows . . . so the air conditioning wasn’t working inside the room . . . when the hearing occurred, there was not only bliss, which is television cameras and double figures, but it was really hot.” Tricks like those described by Sen. Wirth have been refined to an art to promote the cause of economically costly action to prevent supposedly catastrophic consequences of increasing CO2.
Contrast these manipulations with the measured and informative Senate testimony of climatologist John Christy earlier this month.
In an effort to move the science debate completely into the political arena, Mr. Krupp implies that with the exception of a few enlightened Republican governors and captains of industry, most “conservatives” are climate skeptics - and vice versa. But some of the most formidable opponents of climate hysteria include the politically liberal physics Nobel laureate, Ivar Giaever; famously independent physicist and author, Freeman Dyson; environmentalist futurist, and father of the Gaia Hypothesis, James Lovelock; left-center chemist, Fritz Vahrenholt, one of the fathers of the
German environmental movement, and many others who would bristle at being lumped into the conservative camp.
Whether increasing CO2 in the atmosphere is bad or good is a question of science. And in science, truth and facts are not the playthings of causes, nor a touchstone of political correctness, nor true religion, nor “what I tell you three times is true.”
Humanity has always dealt with changing climate. In addition to the years of drought and excessive moisture described above, the geological record makes it clear that there have been longer-term periods of drought, lasting for many years as during the Dust Bowl of the 1930s to many decades or centuries. None of these past climate changes, which had a profound effect on humanity, had anything to do with CO2, and there are good reasons for skepticism that doubling CO2 will make much difference compared to natural climate changes.
It is increasingly clear that doubling CO2 is unlikely to increase global temperature more than about one degree Celsius, not the much larger values touted by the global warming establishment. In fact, CO2 levels are below the optimum levels for most plants, and there are persuasive arguments that the mild warming and increased agricultural yields from doubling CO2 will be an overall benefit for humanity. Let us debate and deal with serious, real problems facing our society, not elaborately orchestrated, phony ones, like the trumped-up need to drastically curtail CO2 emissions.
Roger W. Cohen
Fellow, American Physical Society
La Jolla, Calif.
William Happer
Princeton University
Princeton, N.J.
Richard S. Lindzen
Massachusetts Institute of Technology
Cambridge, Mass.
ICECAPJoin our efforts to Secure America's Borders and End Illegal Immigration by Joining ALIPAC's E-Mail Alerts network (CLICK HERE)
-
11-24-2012, 03:30 PM #15Senior Member
- Join Date
- May 2007
- Location
- South West Florida (Behind friendly lines but still in Occupied Territory)
- Posts
- 117,696
Aug 13, 2012
Oreskes, the Queen of Climate Smear, Ignores the Big Money, has No Evidence, Throws Names
Written by JoNova | August 08 2012
Youd expect a professor to have done the basic research.
Naomi Oreskes is famous (of sorts) for the book: Merchants of Doubt - it seeds doubts about skeptics by saying that skeptics seed doubts about climate change.
The skeptics seed doubts by questioning the evidence and pointing to contrary results (isnt this known as discussion?). Orsekes seeds doubts by digging through biographies, analyzing indirect payments of minor amounts, hunting through unrelated topics and tenuous associations from 20 year old contracts.
The hypocrisy of saying that skeptics attack the messenger is lost on Orsekes who specializes in attacking the messengers.
Oreskes work is based on a logical fallacy, inept research, and incompetent reasoning.
What is remarkable is that so many intellectuals or journalists cant or wont see through her thin rhetoric.
1.Oreskes can name virtually no significant funding for skeptics. Skeptics are almost all unpaid volunteers, working out of professional and patriotic duty, appalled by the illogical, anti-science sentiments of people like Oreskes.
2.The enormous vested interests are well over a thousand to one in favor of alarmism as measured by funding, yet Oreskes has not even considered them. The largest proactive skeptical organization (Heartland) has a budget that is one hundredth of Greenpeace and WWFs combined. Funding for alarmist research since 1990 is at least $79 billion, and probably a lot higher. Funding for skeptical research is so small, no one can add it up. The oil giants like Shell and BP mostly support alarmism and carbon markets. The global carbon market was worth $176 bn in 2011, about the same as the global wheat trade, and the renewables investments added up to $243 bn in 2010. These are very large amounts of vested interest. Since Oreskes is blind to the real money in the debate we can only assume she is an activist rather than a historian.
3.She resorts to twenty year old documents about tobacco funding to smear by association because she has so little real evidence of actual funding or misbehavior of skeptics. As it happens, Fred Singer was never directly paid by a tobacco company, has never doubted that smoking causes cancer, but corrected a scientific error in a paper on passive smoking. He deserves thanks. Oreskes owes him an apology.
4.Skeptics far outrank believers in both numbers and in scientific kudos. They have won real Nobel Prizes in physics, the climate scientists Oreskes quotes have won Peace Prizes. Skeptics can name 31,500 scientists including 9,000 PhDs and hundreds of professors. The IPCC can name 62 people who reviewed the critical chapter nine of the IPCC Fourth Assessment Report, some of them reviewing their own work. Alarmists dont try to counter the Petition Project with a petition of their own because, even with all their supporters on the scientific gravy train, they dont stand a chance of coming up with a number large enough to prop up their claims that 97% of scientists agree.
5.Oreskes claims deniers attack the messenger, which on its face is true, except that she is the one who denies the evidence and attacks the messenger. She is the Queen of Smear and The Merchant of Doubt herself. Virtually no one has done more to smear opponents in this debate than she has. She refers to them continuously as Deniers - though she cannot name any evidence they deny, she has dug mindlessly into the paltry funding, biographies, or association and connections with topics that are totally unrelated to our atmosphere. Skeptics keep asking for evidence. Its been 30 months since I asked, and no one can provide THAT mystery paper that supports the catastrophic claims.
6.Oreskes keeps stating that CO2 is a greenhouse gas, and increases the temperature of the planet, but almost all the leading skeptics agree with it. Why does she keep stating it, as if it is a point of contention? She wants the audience to believe that this is what the debate is about, while the skeptics agree that CO2 is a greenhouse gas that causes warming - but dispute the feedbacks asserted by models (which account for two thirds of the forecast increase in temperatures), but which is completely absent in the observations. Is Oreskes ignorant and incompetent in assessing the real scientific debate or is she deliberately deceiving her audience? Only she knows.
When she says those in denial reject the scientific evidence, she mistakenly believes that evidence about climate change is an internet poll of government funded researchers. Its an anti-science position akin to witchcraft. Tens of thousands of real scientists, including men who walked on the moon, and Nobel Prize winners of physics, know that evidence for climate change comes from thermometers, ice cores, satellites and fossils. Real scientists can quote 1,100 peer reviewed papers that support their skepticism. Naomi Oreskes can quote no real evidence that supports her catastrophic pet hypothesis. Instead she thinks computer simulations produce observations and scientists opinions are worth measuring and quoting.
Oreskes event at Curtin in Perth on Thursday is advertised with the following:
Professor Naomi Oreskes will host a discussion where she will outline the political and ideological roots of climate change denial, showing the linkages between neo-liberalism - the revival of classical commitments to laissez-faire economics - and the rejection of the scientific evidence of man-made climate change. Professor Oreskes will show how those who are committed to laissez faire reject the scientific evidence, and attack the scientific messenger. And she will suggest that the way forward is to focus on solutions, particularly solutions that minimize government interventions in the market-place.
Since skeptics dont deny any scientific evidence, her theories about neoliberalism collapse in a hole, doomed by an error cascade that starts with her first phrase. Heres an alternate hypothesis: Scientists reject man-made global warming because its wrong (it lacks empirical support), not because of their political beliefs. The models she claims are working fail on global, regional, and local scales, they fail on short term forecasts, get core assumptions wrong and cant explain long term historic climate movements either.
The question she ought be researching is why those of a collectivist, big-government nature are so blind to the mountain of evidence staring them in the face. Could it be that a scientific theory that suggests we need a larger, more regulatory and powerful government involvement appeals to exactly the same people who dislike individual responsibility and real free markets? Those who call for free market solutions to climate change are the ones who dont understand what a free market is. In a real free market, governments dont set the price, create an artificial demand, determine the supply and tweak the rules to get the outcome they want, picking the winners in the energy game.
She is in denial about what science is, what evidence is, about the mass movement of whistleblowing scientists storming across the web, and about the vested interests.
The hypocrisy is blatant. Why is UWA supporting her as a 2012 UWA Institute of Advanced Studies Professor-at-Large? Who is paying for her to come, and why are UWA standards so low that they continue to support her smear campaign?
The first and only thing you need to know about Oreskes is that she does not understand what science is. Although shes called a science historian, whenever she refers to The Science or The Evidence she is not referring to science as understood by Faraday, Einstein, Bohr or Fleming. Where they hold empirical evidence and the data to be the ultimate decider, Oreskes thinks science is done by voting, and only an annointed subclass of scientists is allowed to cast their opinion.
Naomi Oreskes is speaking at UWA today. UWA needs to justify how much taxpayers money they contribute to propagating something that is so clearly not science, but not even competent research. In years to come, UWA and Scripps will be embarrassed that their science faculties should promote something so unscientific.
-------------
Icecap Note: In August 2012, a climate extremist addressed to various skeptical climate researchers what he offensively called an appeal to you to be reasonable. Christopher Monckton of Brenchley replied, whereupon the extremist - unable or unwilling to produce a single scientific argument - said he did not wish to pursue the debate further. This paper is an extended version of the reply to the climate extremist.
Aug 12, 2012
Not so hot - ocean temperatures around the USA are not anywhere near record levels
By Bob Tisdale, Guest post on WUWT
Posted on August 10, 2012 by Anthony Watts
While theres wailing and gnashing of teeth over the US CONUS surface temperature being the hottest ever a cursory review of the sea surface temperatures in U.S.Coastal waters shows no cause for alarm, as they arent even close to record levels. Its just one more reason to suspect that UHI and thermometer siting issues are a major forcing component of the surface temperature record. - Anthony
Are July 2012 Sea Surface Temperatures for U.S. Coastal Waters Also At Record Levels?
Guest post by Bob Tisdale
The map in Figure 1 shows the July 2012 sea surface temperature anomalies, based on NOAAs ERSST.v3b dataset, for the coordinates of 24N-50N, 130W-65W.
Figure 1
Well use those coordinates for the sea surface temperatures (not anomalies) of the U.S. Coastal Waters in the following two graphs. Figure 2 illustrates the July sea surface temperatures for those coordinates from 1854 to 2012, and Figure 3 shows the annual (ending in July) sea surface temperatures for U.S. Coastal Waters from 1855 to 2012. Ive also plotted the July 2012 value in Figure 2 and the value for the period ending in July 2012 in Figure 3 to simplify your task of comparing the most recent temperatures to the earlier values.

Figure 2
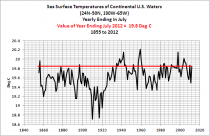
Figure 3
The sea surface temperatures of U.S. Coastal Waters are nowhere close to being at record levels for the month of July 2012 or the 12-month period ending in July 2012. Ill let you decide (speculate about) what that means with respect to the claims of unprecedented U.S. land surface temperatures in July 2012.
My priority is finishing my book about ENSO and its multiyear aftereffects. Ive only got a few more chapters to write and then Im done with the first draft of Who Turned on the Heat? The Unsuspected Global Warming Culprit, El Nino Southern Oscillation. Then I have to go back and read the 500+ pages to see what I wrote.
SOURCE
The map and the data presented are available through the KNMI Climate Explorer.
Aug 10, 2012
THE DAMAGE TO THE CREDIBILITY OF MY PROFESSION IS HUGE
By Steve Hayward, Powerline Blog
Thats the takeaway line from meteorologist Cliff Mass on his Cliff Mass Weather Blog today, delivering a savage beatdown on the latest global warming scaremongering from NASAs egregious James Hansen about recent summer heat waves: It follows that we can state, with a high degree of confidence, that extreme anomalies such as those in Texas and Oklahoma in 2011 and Moscow in 2010 were a consequence of global warming because their likelihood in the absence of global warming was exceedingly small. Mass thinks this is a mass of hot air.
Who is Cliff Mass, and why should we pay attention to him? Mass is an atmospheric scientist at the University of Washington. Hes no climate skeptic; as he says in the post quoted in the headline here, I believe that human-induced global warming is both observed, real, and a serious problem for mankind. But to his credit he thinks politicized, agenda-driven scientists like James Hansen, and the credulous media that always give credence to every poorly reasoned claim, do more harm than good.
Theres a lot in his cogent post, and its worth reading the whole thing. But heres the most important part:
Now as the earth warms up the temperature variations shown remain like the bell curve...or Gaussian, but the mean should shift to warmer temperatures (see the figure below). The result is that you get more warm extremes and less cold extremes (less cold extremes are not mentioned very often for some reason).
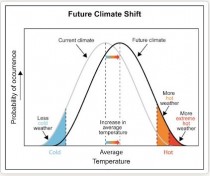
So the result is that you seem more warm temperature records and less cold temperature records. We are in fact seeing this. The earth is warming and there are more maximum temperature records than cold ones. Hansen and friends make a big deal about this.
But what they are not telling you is that the very warm anomalies we are seeing today would have been nearly as large if global warming had never occurred. In his paper he makes a big deal about large (three sigma) anomalies from climatology. Well, without any global warming the anomalies might have been say 2.8 sigma. Or in terms of terms, heat waves of 10F might have been only 9F if global warming had not occurred. To say it differently, the impact of global warming due to greenhouse gases is still small compared to natural processes, and the impacts to society would have been pretty much the same. But you never hear it this way. Those exaggerating the global warming signal imply that we are going from normal conditions to extremes due to global warming. In reality, we go from naturally induced extremes, to a bit stronger extremes due to global warming.
Mass adds:
As an aside, the journal that this article was published in the Proceedings of the National Academy of Sciences (PNAS) allows members of the National Academy (like Dr. Hansen) to publish articles with essentially no peer review. Until 2010 they could publish anything, with no peer review, and most recently the submission review is supervised by the submitting academy member WHO GETS TO SELECT THE REVIEWERS. Folks, this is really unfortunate for an entity that claims to be national journal of some reputation. The result has been a lot of very bad papers in PNAS that would never have been accepted in real journals,with a real peer review process. One could use stronger words, but this is a family blog.
Like Al Gore, reckless scientists like Hansen are the climate skeptics best friend.
By the way, has Hansen won a Green Weenie yet?
ICECAP
Join our efforts to Secure America's Borders and End Illegal Immigration by Joining ALIPAC's E-Mail Alerts network (CLICK HERE)
-
11-24-2012, 03:31 PM #16Senior Member
- Join Date
- May 2007
- Location
- South West Florida (Behind friendly lines but still in Occupied Territory)
- Posts
- 117,696
Aug 09, 2012
The Utter Desperation of Global Warming Liars
By Alan Caruba
The more the public grows skeptical of the global warming hoax, the more desperate the charlatans behind it become.
There is no global warming if by that one means a sudden, dramatic increase in the overall temperature of the Earth. It is not, nor ever was, caused by an increase in carbon dioxide (CO2) in the Earths atmosphere; currently a miniscule 0.038 percent. Climate science has demonstrated that CO2 increases show up centuries after a major change in the Earths temperature, not before.
In recent testimony before the Senate Committee on Environment and Public Works, Dr. John Christy, Alabamas state climatologist, a professor of atmospheric science and director of the Earth System Science Center at the University of Alabama, Huntsville, said, It is popular again to claim that extreme events, such as the current central U.S. drought are evidence of human-caused climate change. Actually, the Earth is very large, the weather is very dynamic, and extreme events will continue to occur somewhere, every year, naturally. The recent extremes were exceeded in previous decades.
Recent examples of the Warmists to convince the public that the Earth is in peril include an opinion by the president of the radical Environmental Defense Fund, Fred Krupp, in The Wall Street Journal, and a PBS television report featuring NASAs Dr. James Hansen, offering a statistical analysis as bogus as his 1988 testimony that global warming was man-made and going to kill us all if we didnt destroy the economy by outlawing CO2 emissions.
Noted meteorologist, Anthony Watts, whose website, WattsUpWithThat, is a treasure trove of real climate science, dismissed Hansens PBS presentation of bell curve charts claiming the current drought conditions as proof of global warming. This bell curve proves nothing, said Watts. This is nothing but a political ploy from a man who has abandoned any pretext of professionally done science in favor of activism. Watts research has demonstrated how corrupt many of the temperature findings have been due to the sites where thermometers have been placed as well as the many places on Earth where there are none.
In The Wall Street Journal Krupp penned a plea for A New Climate-Change Consensus. Bear in mind that the nexus of the global warming hoax has been the United Nations Intergovernmental Panel on Climate Change (IPCC) and it has claimed for years that a consensus of scientists worldwide agrees that global warming is real. The data on which the IPCC claim was made was exposed in 2009 when emails between the scientists providing it revealed their panic over the signs of a global cooling cycle that had begun in 1998. The Earth has been cooling ever since.
Science does not work by consensus. It works by the rigorous testing of hypotheses and theories.
Even Krupp noted that One scorching summer doesnt confirm that climate change is real any more than a white Christmas proves its a hoax. True. However, year after year of thoroughly debunked data by our own government agencies like NASA doesnt make it real either. Did I mention that Dr. Hansen is the Director of NASAs Goddard Institute for Space Studies?
About the only truth Krupp stated was that Some proposed climate solutions, if not well designed or thoughtfully implemented, could damage the economy and stifle short-term growth. Or any growth for that matter.
As this is written, the Environmental Protection Agency is seeking to apply draconian limits on CO2 emissions for every single entity of the U.S. economy from large companies to small businesses. Despite centuries of U.S. coal reserves, the EPA has been hard at work putting coal mining operations and coal-burning plant that generates electricity out of business.
Steven Goddard, writing in the August 6th edition of Real Science, was quick to point out that There were twice as many daily all-time high temperature records set or tied during the 1930s as in the 2000s, for USHCN stations which were operational during both decades. That is why he (Hansen) doesnt start his baseline (for the charts he showed in the PBS program) until the 1950s.
Neither Krupps sweet words of inducement to global warming skeptics, nor Dr. Hansens lies add up to the fact that there is no global warming and never was except in the minds of those who sought to profit from selling carbon credits to industries and individuals who wanted permission to cause emissions of CO2 for any reason.
There ought to be a chart concerning how global warming lies rise and fall with each climate event like a drought or each new revelation of scientific fact that disputes and debunks the hoax.
Aug 08, 2012
You call this compromise?
By Craig Idso, American Thinker
In a Wall Street Journal opinion article published on August 6, 2012, Fred Krupp, president of the Environmental Defense Fund, issued an appeal calling for a new climate-change consensus among climate alarmists (those who believe society\s burning of fossil fuels is causing modern-day global warming and who are alarmed at its potential climatic consequences) and climate skeptics (those who consider that mankinds contribution to present and future climate, if any, will be mostly benign).
To jump start this proposed alliance, Krupp asks that both sides of the debate agree to two "basic truths so that a bipartisan, multi-stakeholder plan of action can be implemented to safeguard the natural systems on which our economic future depends.
The first of these so-called truths is that dramatic alterations to the climate are here and likely to get worse - with profound resultant damage to the economy - unless sustained action is taken. His choice of sources to support this claim, however, is pitiful. He cites a non-peer-reviewed, editorialized story from the Economist that blames CO2-induced global warming for melting the Arctic, and a yet-to-be published scientific study that claims climate change is almost entirely due to greenhouse-gas pollution. Then, after philosophizing a bit as to why skeptics think the way they do on this issue, he proceeds with an appeal to authority, citing statements from two Republican Governors who think the climate is indeed changing due to rising greenhouse gases, along with the results of a political poll on global warming beliefs, which suggests that a majority of the respondents feel it is human-caused. Yet, if there is any human enterprise that should be free of appeal to authority, it is science, where observation and impartial analysis are supposed to reign supreme.
In considering Mr. Krupps first truththat dramatic alterations to the climate are here to stay and will be amplified in the futureit is clear that he could benefit from an old-fashioned review of the pertinent scientific literature, and not just the science that has been selectively edited by the United Nations Intergovernmental Panel on Climate Change, but the voluminous science that has appeared in a vast array of peer-reviewed publications that runs counter to the assertions presented in his first truth (see, for example, the thousands of peer-reviewed journal articles that are referenced by the Nongovernmental International Panel on Climate Change at Climate Change Reconsidered: The Website of the Nongovernmental International Panel on Climate Change (NIPCC)).
If Mr. Krupp truly studied these materials, he would learn there is nothing unusual, unnatural or unprecedented about Earths current climate. He would learn, for example, that although the world has warmed substantially over the past century or more, real-world data demonstrate that none of the environmental catastrophes that are predicted by climate alarmists to be produced by such a warming has come to pass. He would also learn that the climate of the Arctic is highly variable, and that temperatures were as warm there in the 1930s as they are currently. And he would learn that temperatures in the Antarctic have remained stable, that sea ice in the Southern Hemisphere has expanded equator-ward, that the planets great ice sheets are not in danger of collapse, that present-day storms, drought, floods, hurricanes, heat waves and other extreme weather phenomena are not exceptional within the context of the past 2000 years. Most importantly, he would learn that carbon dioxide is not a pollutant, but a precious life-giving and life-sustaining molecule to which we all owe our very existence, and from which we will continue to benefit as it rises in the future by increasing global crop yields, among other remunerations (see The Many Benefits of Atmospheric CO2 Enrichment).
With respect to the second of the two truths that Krupp attempts to sell us, he encourages everyone to accept that some proposed climate solutions, if not well designed or thoughtfully implemented, could damage the economy and stifle short-term growth. But this feigned attempt at compromise with the worlds climate skeptics presupposes that there is indeed a climate problem to be solved. Real-world data, however, suggest otherwise.
The best policy when it comes to emissions of carbon dioxide is to let well enough alone. The Industrial Revolution has been a tremendous boon to humanity, as it has lifted large numbers of mankind from poverty to prosperity. And the increase in the atmospheres carbon dioxide concentration that has accompanied it has likewise significantly increased the productivity of farmers the world over, thanks to its aerial-fertilization and water-use-efficiency enhancing effects.
Clearly, fossil-fuel-derived energy has served us well in the past, and it will serve us well in the future. Letting nature and the market place take their unimpeded courses is the path of prudence that will bring unbounded prosperity to generations yet unborn in every corner of the globe.
Dr. Craig D. Idso is Chairman, Center for the Study of Carbon Dioxide and Global Change
Aug 08, 2012
Harry Reids Cherry Blossom Picking: FAIL
Quote of the Week - WUWT
Senator Harry Reids Press Release: Time To Stop Acting Like Climate Change Deniers Have A Valid Point Of View - They Dont
If skeptics had taken a stroll along Potomac River on a 70-degree day this Feb., they would have seen cherry trees blossoming earlier than at any time since they were planted 100 years ago
Umm, no. Lets go to the data.

Japanese cherry trees (Sakura), a gift from Japan in 1965, adorn the Tidal Basin in Washington, D.C. during the National Cherry Blossom Festival. The Washington Monument is visible in the distance. (Photo credit: Wikipedia)
Correction for Reid: Both 1990 and 2000 had earlier blooms:
The National Park Service (NPS) has confirmed Washington, D.C.s cherry blossoms peaked on March 20, tied for third earliest on record.
In the NPSs 92-year record dating back to 1921, the only years with earlier bloom dates were 1990 (March 15) and 2000 (March 17) . Three other years in the record matched this years peak bloom date of March 20: 1921, 1927, and 1945.
Youd think with a well paid staff at his disposal, Senator Reid could at least do some fact checking before bloviating about how deniers have no valid point of view.
How embarrassing it must be that we mere bloggers have to point out his factual gaffes he and his staff miss.
[UPDATE: My friend, nationally syndicated radio show talk host Lars Larson has the ultimate zinger for this where he says:
You know, I think this qualifies Senator Reid of Nevada as an official Blooming Idiot. ]
Here is Senator James Inhofes Press Release on Reids announcement:
He says the time to act is now - yet Reid hasnt brought a cap-and-trade bill to floor since 2008, & hes the one who said cap-and-trade had been deleted from his dictionary
If its time to act on anything, it would be to stop President Obama from implementing these global warming policies that the American people have clearly rejected
Perhaps the title should have been: Time To Stop Acting Like Senator Reid Has A Valid Point Of View on Global Warming - He Doesnt
Enlarged
ICECAPJoin our efforts to Secure America's Borders and End Illegal Immigration by Joining ALIPAC's E-Mail Alerts network (CLICK HERE)
-
11-24-2012, 03:36 PM #17Senior Member
- Join Date
- May 2007
- Location
- South West Florida (Behind friendly lines but still in Occupied Territory)
- Posts
- 117,696
Aug 05, 2012
Summary Of Two Game-Changing Papers - Watts Et al 2012 and McNider Et Al 2012
By Dr. Roger Pielke Sr., Climate Science
UPDATE #2: To make sure everyone clearly recognizes my involvement with both papers, I provided Anthony suggested text and references for his article [I am not a co-author of the Watts et al paper], and am a co-author on the McNider et al paper.
UPDATE: There has been discussion as to whether the Time of Observation Bias (TOB) could affect the conclusions reached in Watts et al (2012). This is a valid concern. Thus the “Game Changing” finding of whether the trends are actually different for well- and poorly-sited locations is tenative until it is shown whether or not TOB alters the conclusions. The issue, however, is not easy to resolve. In our paper
Pielke Sr., R.A., T. Stohlgren, L. Schell, W. Parton, N. Doesken, K. Redmond, J. Moeny, T. McKee, and T.G.F. Kittel, 2002: Problems in evaluating regional and local trends in temperature: An example from eastern Colorado, USA. Int. J. Climatol., 22, 421-434.
this is what we concluded [highlight added]
The time of observation biases clearly are a problem in using raw data from the US Cooperative stations. Six stations used in this study have had documented changes in times of observation. Some stations, like Holly, have had numerous changes. Some of the largest impacts on monthly and seasonal temperature time series anywhere in the country are found in the Central Great Plains as a result of relatively frequent dramatic interdiurnal temperature changes. Time of observation adjustments are therefore essential prior to comparing long-term trends.
We attempted to apply the time of observation adjustments using the paper by Karl et al. (1986). The actual implementation of this procedure is very difficult, so, after several discussions with NCDC personnel familiar with the procedure, we chose instead to use the USHCN database to extract the time of observation adjustments applied by NCDC. We explored the time of observation bias and the impact on our results by taking the USHCN adjusted temperature data for 3 month seasons, and subtracted the seasonal means computed from the station data adjusted for all except time of observation changes in order to determine the magnitude of that adjustment. An example is shown here for Holly, Colorado (Figure 1), which had more changes than any other site used in the study.
What you would expect to see is a series of step function changes associated with known dates of time of observation changes. However, what you actually see is a combination of step changes and other variability, the causes of which are not all obvious. It appeared to us that editing procedures and procedures for estimating values for missing months resulted in computed monthly temperatures in the USHCN differing from what a user would compute for that same station from averaging the raw data from the Summary of the Day Cooperative Data Set. This simply points out that when manipulating and attempting to homogenize large data sets, changes can be made in an effort to improve the quality of the data set that may or may not actually accomplish the initial goal.
Overall, the impact of applying time of observation adjustment at Holly was to cool the data for the 1926-58 with respect to earlier and later periods. The magnitude of this adjustment of 2C is obviously very large, but it is consistent with changing from predominantly late afternoon observation times early in the record to early morning observation times in recent years in the part of the country where time of observation has the greatest effect. Time of observation adjustments were also applied at five other sites.
Until this issue is resolved, the Game Changer aspect of the Watts et al 2012 study is tenative. [Anthony reports he is actively working to resolve this issue on hold ]. The best way to address the TOB issue is to use data from sites in the Watts et al data set that have hourly resolution. For those years, when the station is unchanging in location, compute the TOB. The Karl et al (1986) method of TOB adjustment, in my view, needs to be more clearly defined and further examined in order to better address this issue. I understand research is underway to examine the TOB issue in detail, and results will be reported by Anthony when ready.
--------
There are two recent papers that raise serious questions on the accuracy of the quantitative diagnosis of global warming by NCDC, GISS, CRU and BEST based on land surface temperature anomalies. These papers are a culmination of two areas of uncertainty study that were identified in the paper
Pielke Sr., R.A., C. Davey, D. Niyogi, S. Fall, J. Steinweg-Woods, K. Hubbard, X. Lin, M. Cai, Y.-K. Lim, H. Li, J. Nielsen-Gammon, K. Gallo, R. Hale, R. Mahmood, S. Foster, R.T. McNider, and P. Blanken, 2007: Unresolved issues with the assessment of multi-decadal global land surface temperature trends. J. Geophys. Res., 112
The Summary
One paper [Watts et al 2012] show that siting quality does matter. A warm bias results in the continental USA when poorly sited locations are used to construct a gridded analysis of land surface temperature anomalies.
The other paper [McNider et al 2012] shows that not only does the height at which minimum temperature observations are made matter, but even slight changes in vertical mixing (such as from adding a small shed near the observation site, even in an otherwise pristine location) can increase the measured temperature at the height of the observation. This can occur when there is little or no layer averaged warming.
The Two Papers
Watts et al, 2012: An area and distance weighted analysis of the impacts of station exposure on the U.S. Historical Climatology Network temperatures and temperature trends [to be submitted to JGR]
McNider, R. T., G.J. Steeneveld, B. Holtslag, R. Pielke Sr, S. Mackaro, A. Pour Biazar, J. T. Walters, U. S. Nair, and J. R. Christy (2012). Response and sensitivity of the nocturnal boundary layer over land to added longwave radiative forcing, J. Geophys. Res. in press. [for the complete paper, click here]
To Provide Context
First, however, to make sure that my perspective on climate is properly understood;
i) There has been global warming over the last several decades. The ocean is the component of the climate system that is best suited for quantifying climate system heat change [Pielke, 2003] e.g. see the figure below from NOAA’s Upper Ocean Heat Content Anomaly for their estimate of the magnitude of warming since 1993
ii) The human addition to CO2 into the atmosphere is a first-order climate forcing; e.g. see Pielke et al (2009) and the NOAA plot below
However, the Watts et al 2012 and McNider et al 2012 papers refute a major assumption in the CCSP 1.1 report
Temperature Trends in the Lower Atmosphere - Understanding and Reconciling Differences
that variations in surface temperature anomalies are random and this can be averaged to create area means that are robust measures of the average surface temperature in that region (and when summed globally, provide an accurate global land average surface temperature anomaly). Randomness, and with assumption of no systematic biases, is shown in the two papers to be incorrect.
In the chapter
Lanzante et al 2005: What do observations indicate about the changes of temperatures in the atmosphere and at the surface since the advent of measuring temperatures vertically?
they write that [highlight added]
“Currently, there are three main groups creating global analyses of surface temperature (see Table 3.1), differing in the choice of available data that are utilized as well as the manner in which these data are synthesized.
Comment: Now there is the addition of Richard Muller’s BEST analysis.
Since the network of surface stations changes over time, it is necessary to assess how well the available observations monitor global or regional temperature. There are three ways in which to make such assessments (Jones, 1995). The first is using “frozen grids” where analysis using only those grid boxes with data present in the sparsest years is used to compare to the full data set results from other years (e.g., Parker et al., 1994). The results generally indicate very small errors on multi-annual timescales (Jones, 1995). “
My Comment: The “frozen grids” combine data from poor- and well-site locations, and from different heights. A warm bias results. This is a similar type of analysis as used in BEST.
The second technique is sub-sampling a spatially complete field, such as model output, only where in situ observations are available. Again the errors are small (e.g., the standard errors are less than 0.06C for the observing period 1880 to 1990; Peterson et al., 1998b).
My Comment: Again, there is the assumption that no systematic biases exist in the observations. Poorly sited locations are blended with well-sited locations which, based on Watts et al (2012), artificially elevates the sub-sampled trends.
The third technique is comparing optimum averaging, which fills in the spatial field using covariance matrices, eigenfunctions or structure functions, with other analyses. Again, very small differences are found (Smith et al., 2005). The fidelity of the surface temperature record is further supported by work such as Peterson et al. (1999) which found that a rural subset of global land stations had almost the same global trend as the full network and Parker (2004) that found no signs of urban warming over the period covered by this report.
My Comment: Here is where the assumption that the set of temperature anomalies are random is presented. Watts et al (2012) provide observational evidence, and McNider et al (2012) present theoretical reasons, why this is an incorrect assumption.
Since the three chosen data sets utilize many of the same raw observations, there is a degree of interdependence. Nevertheless, there are some differences among them as to which observing sites are utilized. An important advantage of surface data is the fact that at any given time there are thousands of thermometers in use that contribute to a global or other large-scale average. Besides the tendency to cancel random errors, the large number of stations also greatly facilitates temporal homogenization since a given station may have several “near-neighbors” for “buddy-checks.” While there are fundamental differences in the methodology used to create the surface data sets, the differing techniques with the same data produce almost the same results (Vose et al., 2005a).
My Comment: There statement that there is “the tendency to cancel random errors” is shown in the Watts et al 2012 and McNider et al 2012 papers to be incorrect. This means their claim that “the large number of stations also greatly facilitates temporal homogenization since a given station may have several “near-neighbors” for “buddy-checks.” is erroneously averaging together sites with a warm bias.
Bottom Line Conclusion: The Watts et al 2012 and McNider et al 2012 papers have presented the climate community with evidence of major systematic warm biases in the analysis of multi-decadal land surface temperature anomalies by NCDC, GISS, CRU and BEST. The two paper also help explain the discrepancy seen between the multi-decadal temperature trends in the surface and lower tropospheric temperature that was documented in
Klotzbach, P.J., R.A. Pielke Sr., R.A. Pielke Jr., J.R. Christy, and R.T. McNider, 2009: An alternative explanation for differential temperature trends at the surface and in the lower troposphere. J. Geophys. Res., 114, D21102, doi:10.1029/2009JD011841.
Klotzbach, P.J., R.A. Pielke Sr., R.A. Pielke Jr., J.R. Christy, and R.T. McNider, 2010: Correction to: “An alternative explanation for differential temperature trends at the surface and in the lower troposphere. J. Geophys. Res., 114, D21102, doi:10.1029/2009JD011841″, J. Geophys. Res., 115, D1, doi:10.1029/2009JD013655.
I look forward to discussing the conclusions of these two studies in the coming weeks and months.
Aug 04, 2012
Spanish Renewable Lesson for Obama
By Andres Cala, Energy Tribune
Spain is planning to correct its renewable energy experiment gone wrong by spreading the pain, a powerful lessons for a White House with an incoherent energy policy that has often cited its model as one to emulate.
This week Obama’s campaign bashed challenger Mitt Romney for planning to end tax incentives for wind power if elected. “By opposing an extension to the wind production tax credit, Mitt Romney has come out against growth of the wind industry to support 100,000 jobs by 2016 and 500,000 jobs by 2030.”
Obama’s expectations though are based on European policy support models that are being revised and corrected. Ahead of November elections, both candidates must realize America’s energy policy more than ever demands a coherent policy based on its best interest not ideological imperatives.
Putting renewable on steroids can come to damage a country’s power sector, consumers, and the renewable industry itself, and in Spain’s case, even a national economy.
Public support for renewable power in America thus should be reconfigured to achieve realistic economic or geopolitical net gain, not winning elections.
During the first two years of his administration, President Barack Obama and top officials praised Spain as a successful model to create employment and improve energy security. So did everyone else, for that matter, but it’s time to heed the lessons.
For over a decade Spain has accumulated nearly 25 billion euro in debt –equivalent to more than half of the urgent capitalization needs of its distraught financial system- mostly in the form of subsidies for wind and solar energy.
Basically the country did not pass along to consumers the cost of generating around 30 percent of its electricity through renewable sources, and faced with the prospect of a macroeconomic sovereign collapse it has decided to hike taxes for power utilities, to increase consumer prices, and to cut some of the generous subsidies that the renewable industry has enjoyed.
The conservative government’s proposed solution has expectedly enraged all sides, although the final reforms will not be decreed until later this month.
All sides have legitimate grievances. After all, hiking consumer electricity prices during a recession is beating a dead horse; renewable players say the back-peddling will all but kill their industry already hit by an earlier moratorium imposed on new renewable projects, and utilities say more taxes will only mean more layoffs and less investment.
Furthermore, Spain’s generous subsidies already attracted more than twice as much installed capacity than its peak demand of 40 GW, and much cheaper fossil fuel and nuclear generators are being left idle to pay for renewable output.
In this context, the country has no choice but to pull the plug on its renewable experiment. More than a decade of robust Spanish growth ended in 2008 as a construction boom went bust leaving millions without a job and as the global economic crisis further undermined the economy.
Gross national product in 2012 and 2013 is expected to further contract and unemployment, already the highest of any rich nation at 25 percent, is expected to continue growing and to become increasingly hard structural, according to the OECD.
The IMF estimates Spain needs around 45 billion euros to recapitalize its ailing banks and Europe has already pledged as much as 100 billion euro. But markets are nervous. Spain will eventually have to seek a sovereign bailout like those of Greece, Ireland, and Portugal.
Meanwhile, the difference between the cost of generation and what consumers pay is adding between 7 and 10 billion euros annually in debt, depending of the year, according to the Energy Ministry, 60 percent of which comes from subsidizing renewable power.
The subsidy system itself is also dysfunctional. Solar companies get as much as half of the subsidies, despite contributing less than 5 percent of total power generation in 2011, while wind power gets around a quarter of subsidies despite contributing three times more power.
The government thus plans to raise taxes across the board for power generation between 3 and 20 percent, depending on the source. Fossil fuels, nuclear and hydroelectric would be taxed the least, while renewable would be taxed more. Companies have said consumer prices will inevitably increase.
Utilities, which truth be told are among the biggest investors in renewable power and thus are complicit of the failed experiment, have said tax increases doesn’t address the problem per se and fear the government is simply using them to raise revenue. And renewable energy investors, from international funds to small families, have also blasted planned reforms which they describe as suicidal.
Back to the drawing board
Spain is the worst example, but not the only.
A recent International Energy Agency outlook of renewable power this decade suggests how Spain’s model embodies the “wrongs” of unconditionally supporting the industry.
Now its renewable revision is going to eliminate thousands of jobs and billions in investment, and more critically become another agonizing drag on the economy.
Many countries overdid it, plain and simple. Renewable industries in OECD reached maturity and have become an economic drain, which is why countries are quietly backtracking, as the data shows.
“First, general macroeconomic and credit concerns are increasing capital costs, reducing risk appetites, and prompting investor preferences for higher returns and shorter payback periods, which tend to work against renewable technologies. Second, short-term policy uncertainty in some markets is undermining renewable project economics due to potential changes in financial support,” the IEA said.
The IEA’s report also shows how several technologies are competitive in some markets, able to compete with fossil fuel options. It got there thanks to generous subsidies in countries like Spain, Germany, and Italy, but also the United States, China, and Japan.
Indeed, renewable power is a viable economic option under certain circumstances. And in the US, there are some regions that can make a case for long term economic sustainability, even amid a natural gas glut.
But so far this administration has had an ideological, not economic approach to energy policy. And America can’t afford gambling its energy future. And for that matter, the renewable industry can’t afford it either.
Jul 31, 2012
Why the BEST papers failed to pass peer review
By Anthony Watts, WUWT
Whoa, this is heavy. Ross McKitrick, who was a peer review referee for the BEST papers with the Journal of Geophysical Research got fed up with Muller’s media blitzing and tells his story:
excerpts:
In October 2011, despite the papers not being accepted, Richard Muller launched a major international publicity blitz announcing the results of the “BEST” project. I wrote to him and his coauthor Judy Curry objecting to the promotional initiative since the critical comments of people like me were locked up under confidentiality rules, and the papers had not been accepted for publication. Richard stated that he felt there was no alternative since the studies would be picked up by the press anyway. Later, when the journal turned the paper down and asked for major revisions, I sought permission from Richard to release my review. He requested that I post it without indicating I was a reviewer for JGR. Since that was not feasible I simply kept it confidential.
On July 29 2012 Richard Muller launched another publicity blitz (e.g. here and here) claiming, among other things, that “In our papers we demonstrate that none of these potentially troublesome effects [including those related to urbanization and land surface changes] unduly biased our conclusions.” Their failure to provide a proper demonstration of this point had led me to recommend against publishing their paper. This places me in an awkward position since I made an undertaking to JGR to respect the confidentiality of the peer review process, but I have reason to believe Muller et al.’s analysis does not support the conclusions he is now asserting in the press.
I take the journal peer review process seriously and I dislike being placed in the position of having to break a commitment I made to JGR, but the “BEST” team’s decision to launch another publicity blitz effectively nullifies any right they might have had to confidentiality in this matter. So I am herewith releasing my referee reports.
Read it all here.
Some backstory via Andrew Revkin from Elizabeth Muller. Revkin asked:
1) What’s the status of the four papers that were submitted last fall (accepted, in review...etc?)
2) There can be perils when publicity precedes peer review. Are you all confident that the time was right to post the papers, including the new one, ahead of review? Presumably this has to do with Tuesday deadline for IPCC eligibility?
Here’s her reply:All of the articles have been submitted to journals, and we have received substantial journal peer reviews. None of the reviews have indicated any mistakes in the papers; they have instead been primarily suggestions for additions, further citations of the literature. One review had no complaints about the content of the paper, but suggested delaying the publication until the long background paper, describing our methods in detail, was actually published.
In addition to this journal peer review, we have had extensive comments from other scientists based on the more traditional method of peer review: circulation of preprints to other scientists. It is worthwhile remembering that the tradition in science, going back pre World War II, has been to circulate “preprints” of articles that had not yet been accepted by a journal for publication. This was truly “peer” review, and it was very helpful in uncovering errors and assumptions. We have engaged extensively in such peer review. Of course, rather than sending the preprints to all the major science libraries (as was done in the past), we now post them online. Others make use of arXiv. This has proven so effective that in some fields (e.g. string theory) the journalistic review process is avoided altogether, and papers are not submitted to journals. We are not going to that extreme, but rather are taking advantage of the traditional method.
We note that others in the climate community have used this traditional approach with great effectiveness. Jim Hansen, for example, frequently puts his papers online even before they are submitted to journals. Jim has found this method to be very useful and effective, as have we. As Jim is one of the most prominent members of the climate community, and has been doing this for so long, we are surprised that some journalists and scientists think we are departing from the current tradition.
The journal publication process takes time. This fact is especially true when new methods of analysis are introduced. We will be posting revised versions of 3 of the 4 papers previously posted later today (the 4th paper has not changed significantly). The core content of the papers is still the same, though the organization and detail has changed a fair amount.
The new paper, which we informally call the “Results” paper, has also undergone journal peer review (and none of the review required changing our results). We are posting it online today as a preprint, because we also want to invite comments and suggestions from the larger scientific community.
I believe the findings in our papers are too important to wait for the year or longer that it could take to complete the journal review process. We believe in traditional peer review; we welcome feedback the public and any scientists who are interested in taking the time to make thoughtful comments. Indeed, with the first 4 papers submitted, many of the best comments came from the broader scientific community. Our papers have received scrutiny by dozens of top scientists, not just the two or three that typically are called upon by journalists.
ICECAPJoin our efforts to Secure America's Borders and End Illegal Immigration by Joining ALIPAC's E-Mail Alerts network (CLICK HERE)
-
11-24-2012, 03:38 PM #18Senior Member
- Join Date
- May 2007
- Location
- South West Florida (Behind friendly lines but still in Occupied Territory)
- Posts
- 117,696
Jul 25, 2012
Muller being pummelled; Krugman vs. Research, Who You Gonna Believe?
Update from Roger Pielke Sr on Muller NYT editorial:
In Richard Mullers Op-Ed in the New York Times (see The Conversion of a Climate-Change Skeptic), he makes far-reaching conclusions based on his sparse knowledge of the uncertainties in multi-decadal land surface temperature record. His comments show what occurs when a scientist, with excellent research credentials within their area of scientific expertise, go outside of their area of knowledge.
His latest BEST claims are, in my view, an embarrassment. The statement that he makes in his op-ed that [highlight added]
My total turnaround, in such a short time, is the result of careful and objective analysis by the Berkeley Earth Surface Temperature project, which I founded with my daughter Elizabeth. Our results show that the average temperature of the earths land has risen by two and a half degrees Fahrenheit over the past 250 years, including an increase of one and a half degrees over the most recent 50 years. Moreover, it appears likely that essentially all of this increase results from the human emission of greenhouse gases.is easily refuted. See.
See on Climate Depot how Judith Curry find Mullers study unconvincing and even Michael Mann says Muller is all about self aggrandizement.
----------
Roger Pielke Jr.
In yesterdays NYT Paul Krugman writes:
[R]eally extreme high temperatures, the kind of thing that used to happen very rarely in the past, have now become fairly common. Think of it as rolling two sixes, which happens less than 3 percent of the time with fair dice, but more often when the dice are loaded. And this rising incidence of extreme events, reflecting the same variability of weather that can obscure the reality of climate change, means that the costs of climate change arent a distant prospect, decades in the future. On the contrary, theyre already here, even though so far global temperatures are only about 1 degree Fahrenheit above their historical norms, a small fraction of their eventual rise if we dont act.And here it comes.
The great Midwestern drought is a case in point. This drought has already sent corn prices to their highest level ever. If it continues, it could cause a global food crisis, because the U.S. heartland is still the worlds breadbasket. And yes, the drought is linked to climate change: such events have happened before, but theyre much more likely now than they used to be.
Now, maybe this drought will break in time to avoid the worst. But there will be more events like this. Joseph Romm, the influential climate blogger, has coined the term Dust-Bowlification for the prospect of extended periods of extreme drought in formerly productive agricultural areas. He has been arguing for some time that this phenomenon, with its disastrous effects on food security, is likely to be the leading edge of damage from climate change, taking place over the next few decades; the drowning of Florida by rising sea levels and all that will come later.
Krugmans claims raise an obvious question: Have US droughts actually become more common on climate time scales? Especially US Midwest droughts?
Instead of looking at the musings of a climate blogger (as entertaining as that may be) like Krugman does, lets instead look at scientific research that has examined trends in US droughts. A crazy idea, I know. Fortunately, scientists have examined empirical data on the frequency and severity of drought on climate time scales.
Here is Andreadis and Lettenmaier (2006) in GRL (PDF):
[D]roughts have, for the most part, become shorter, less frequent, less severe, and cover a smaller portion of the country over the last century.
A longer excerpt:
We used a constructed time series of soil moisture and runoff over the continental U.S. to examine trends in soil moisture and runoff, and drought characteristics related to these variables for the period 19252003. Over much of the country, there has been a wetting trend, reflected in a predominance of upward trends in both model-derived soil moisture and runoff. These trends are generally consistent with increases in precipitation during the latter half of the 20th century observed over most of the U.S. [Groisman et al., 2004], and are in general agreement with results from other studies [Dai et al., 2004; Milly et al., 2005]. Furthermore, trends in the simulated runoff are similar to those in observed records of streamflow at a set of index stations that have been minimally affected by anthropogenic activities. Trends in most drought characteristics are similar to those in soil moisture and runoff, that is, droughts have, for the most part, become shorter, less frequent, less severe, and cover a smaller portion of the country over the last century. The main exception is the Southwest and parts of the interior of the West ...About that recent breathless NOAA press release and subsequent media frenzy Have a look at comments by John Neilsen-Gammon and also Cliff Mass, both of whom pushed the button.

PS. Here is the necessary disclaimer to ward off those, like Krugman, who use the notion of deniers to shout down inconvenient voices: Climate change is real, humans have a significant impact on the planet, and mitigation and adaptation policies both make sense, as I argue in The Climate Fix. None of that justifies treating climate science like astrology.
Jul 24, 2012
Droughts in Mexico
By CO2Science
Climate alarmists warn of all sorts of weather disasters, including droughts, as the Earth recovers from the debilitating chill of the Little Ice Age and begins to experience the more benign temperatures of the Current Warm Period. Does history vindicate them? This question is explored via brief reviews of several papers investigating the occurrence of droughts in Mexico.
Stahle et al. (2000) developed a long-term history of drought over much of North America from reconstructions of the Palmer Drought Severity Index, based on analyses of many lengthy tree-ring records. This history revealed the occurrence of a 16th-century drought in Mexico that persisted from the 1540s to the 1580s. Writing of this anomalous period of much-reduced precipitation, they say that the megadrought of the 16th century far exceeded any drought of the 20th century, during the latter of which periods the worlds climate alarmists claim the planet experienced a level of warmth that was unprecedented over the past two millennia and which therefore, according to their reasoning, should have been host to the most extreme lack of moisture of the studied period.
Diaz et al. (2002) constructed a history of winter-spring (November-April) precipitationwhich accounts for one-third of the yearly totalfor the Mexican state of Chihuahua for the period 1647-1992, based on earlywood width chronologies of over 300 Douglas fir trees growing at four locations along the western and southern borders of Chihuahua and at two locations in the United States just above Chihuahuas northeast border. On the basis of these reconstructions, they note that three of the 5 worst winter-spring drought years in the past three-and-a-half centuries are estimated to have occurred during the 20th century. Although this observation tends to make the 20th century look highly anomalous in this regard, it is not; for two of those three worst drought years occurred during a period of average to slightly-above-average precipitation.
Diaz et al. also note that the longest drought indicated by the smoothed reconstruction lasted 17 years (1948-1964), which is again indicative of abnormally dry conditions during the 20th century. However, for several of the 17 years of that below-normal-precipitation interval, precipitation values were only slightly below normal. For all practical purposes, therefore, there were four very similar dry periods interspersed throughout the preceding two and a half centuries: one in the late 1850s and early 1860s, one in the late 1790s and early 1800s, one in the late 1720s and early 1730s, and one in the late 1660s and early 1670s.
With respect to the 20th century alone, there was also a long period of high winter-spring precipitation that stretched from 1905 to 1932; and following the major drought of the 1950s, precipitation remained at or just slightly above normal for the remainder of the record. Finally, with respect to the entire 346 years, there was no long-term trend in the data, nor was there evidence of any sustained departure from that trend over the course of the 20th century, indicating that neither 20th century anthropogenic CO2 emissions nor 20th century warming significantly impacted rainfall in the Mexican state of Chihuahua.
Cleaveland et al. (2003) constructed a winter-spring (November-March) precipitation history for the period 1386-1993 for Durango, Mexico, based on earlywood width chronologies of Douglas-fir tree rings collected at two sites in the Sierra Madre Occidental. They report that this record shows droughts of greater magnitude and longer duration than the worst historical drought that occurred in the 1950s and 1960s. These earlier dramatic droughts included the long dry spell of the 1850s-1860s and what they called the megadrought of the mid- to late-16th century. Their work clearly demonstrates, therefore, that the worst droughts of the past 600 years did not occur during the period of greatest warmth. Instead, they occurred during the Little Ice Age, which was perhaps the coldest period of the current interglacial.
Investigating the same approximate time period, Hodell et al. (2005b) analyzed a 5.1-m sediment core they retrieved from Aguada Xcaamal, a small sinkhole lake in northwest Yucatan, Mexico, finding that an important hydrologic change occurred there during the 15th century AD, as documented by the appearance of A. beccarii in the sediment profile, a decline in the abundance of charophytes, and an increase in the δ1 of gastropods and ostracods. In addition, they report that the salinity and 1 content of the lake water increased as a result of reduced precipitation and/or increased evaporation in the mid- to late 1500s. These several changes, as well as many others they cite, were, as they describe it, part of a larger pattern of oceanic and atmospheric change associated with the Little Ice Age that included cooling throughout the subtropical gyre (Lund and Curry, 2004). Their assessment of the situation was that the climate became drier on the Yucatan Peninsula in the 15th century AD near the onset of the Little Ice Age, as is also suggested by Maya and Aztec chronicles that contain references to cold, drought and famine in the period AD 1441-1460.
Going back even further in time, Hodell et al. (1995) had provided evidence for a protracted drought during the Terminal Classic Period of Mayan civilization (AD 800-1000), based on their analysis of a single sediment core retrieved in 1993 from Lake Chichanacanab in the center of the northern Yucatan Peninsula of Mexico. Subsequently, based on two additional sediment cores retrieved from the same location in 2000, Hodell et al. (2001) determined that the massive drought likely occurred in two distinct phases (750-875 and 1000-1075). Reconstructing the climatic history of the region over the past 2600 years and applying spectral analysis to the data also revealed a significant recurrent drought periodicity of 208 years that matched well with a cosmic ray-produced 14C record preserved in tree rings, which is believed to reflect variations in solar activity; and because of the good correspondence between the two data sets, they concluded that a significant component of century-scale variability in Yucatan droughts is explained by solar forcing.
In a still-later study, Hodell et al. (2005a) returned to Lake Chichanacanab in March of 2004 and retrieved a number of additional sediment cores in some of the deeper parts in the lake, with multiple cores being taken from its deepest point, from which depth profiles of bulk density were obtained by means of gamma-ray attenuation, as were profiles of reflected red, green and blue light via a digital color line-scan camera. As they describe their findings, the data reveal in great detail the climatic events that comprised the Terminal Classic Drought and coincided with the demise of Classic Maya civilization. In this regard, they again report that the Terminal Classic Drought was not a single, two-century-long megadrought, but rather consisted of a series of dry events separated by intervening periods of relatively moister conditions, and that it included an early phase (ca 770-870) and late phase (ca 920-1100). Last of all, they say that the bipartite drought history inferred from Chichancanab is supported by oxygen isotope records from nearby Punta Laguna, and that the general pattern is also consistent with findings from the Cariaco Basin off northern Venezuela (Haug et al., 2003), suggesting that the Terminal Classic Drought was a widespread phenomenon and not limited to north-central Yucatan.
Concurrent with the study of Hodell et al. (2005a), Almeida-Lenero et al. (2005) analyzed pollen profiles derived from sediment cores retrieved from Lake Zempoala and nearby Lake Quila in the central Mexican highlands about 65 km southwest of Mexico City, determining that it was generally more humid than at present in the central Mexican highlands during the mid-Holocene. Thereafter, however, there was a gradual drying of the climate; and their data from Lake Zempoala indicate that the interval from 1300 to 1100 cal yr BP was driest and represents an extreme since the mid-Holocene, noting further that this interval of 200 years coincides with the collapse of the Maya civilization. Likewise, they report that their data from Lake Quila are also indicative of the most arid period reported during the middle to late Holocene from c. 1300 to 1100 cal yr BP. In addition, they note that climatic aridity during this time was also noted by Metcalfe et al. (1991) for the Lerma Basin [central Mexico], that dry climatic conditions were also reported from Lake Patzcuaro, central Mexico by Watts and Bradbury (1982), and that dry conditions were also reported for [Mexicos] Zacapu Basin (Metcalfe, 1995) and for [Mexicos] Yucatan Peninsula (Curtis et al., 1996, 1998; Hodell et al., 1995, 2001).
Also working in central Mexico was Therrell et al. (2006), who developed a continuous, exactly dated, tree-ring reconstruction of maize yield variability over the period 1474 to 2001 in an effort to provide new insight into the history of climate and food availability in the heartland of the Mesoamerican cultural province. This work was made possible by latewood-width data they derived from what they describe as the second-most southerly native stand of Douglas-fir (Pseudtosuga menziesii) trees known in the Americas. In addition, the authors compared their reconstruction to historical records of crop failure and famine in order to cross-validate the tree-ring and historical records. So what did the researchers work reveal?
Therrell et al.s plot of reconstructed drought-induced maize-yield anomalies exposed a total of seven major decadal-scale yield shortfalls over the past 500 years, with a mean rate of occurrence of 1.5 per century over the 400-year period AD 1500-1900. Over the 20th century, however, there was only one such multi-year famine, and its magnitude paled in comparison to that of the average such event of the preceding four centuries. Thus, it appears that the so-called unprecedented warming of the 20th century did not produce the alarmist-predicted effect on drought in central Mexico. In fact, the threat of major drought-induced famines in this part of the world appears to have lessened with increased warming.
In moving toward a consensus on current and historical drought in Mexico, Metcalfe and Davies (2007) synthesized the findings of a variety of paleoclimate studies based on analyses of the sediment records of several crater lakes and lakes formed by lava dams that are scattered across the Trans Mexican Volcanic Belt of central Mexico and that have an absolute chronology provided by radiocarbon dates extending back to 1500 14C yr BP. Noting that the degree of coherence among the records is remarkable, Metcalf and Davis report - in what is perhaps the key finding of their analysis - that dry conditions, probably the driest of the Holocene [italics added], are recorded over the period 1400 to 800 14C yr BP (ca. AD 700-1200), the significance of which finding is augmented by their observation that the present day climate of central Mexico is typical of most of the country. Giving the result even broader significance is the fact that it is, in the words of the two researchers, consistent with results from the Yucatan Peninsula (Hodell et al., 1995, 2005) ... and from the Cariaco basin (Haug et al., 2003) and the Isthmus of Panama (Lachniet et al., 2004).
One year later, Dominguez-Vazquez and Islebe (200 derived a 2000-year history of regional drought for the Lacandon Forest Region in the state of Chiapas, southeastern Mexico. Based on radiocarbon dating and pollen analyses of a sediment core retrieved from the shore of Naja Lake (16°5927.6"N, 91°3529.6"W), the two authors reported finding a marked increase in Pinus pollen, together with a reduction in lower montane rain forest taxa, [that they] interpreted as evidence for a strong, protracted drought from 1260 to 730 years BP, which they characterized as the most severe, while noting that it coincides with the Maya classic collapse.
Returning to the Yucatan Peninsula, Escobar et al. (2010) examined sediment cores from Lakes Punta Laguna, Chichancanab, and Peten Itza as a proxy measure for high-frequency climate variability. In doing so the five researchers say their results indicated that relatively dry periods were persistently dry [italics added], whereas relatively wet periods were composed of wet and dry times. Further, they say their findings confirm the interpretations of Hodell et al. (1995, 2007) and Curtis et al. (1996) that there were persistent dry climate episodes associated with the Terminal Classic Maya Period. In fact, they find that the Terminal Classic Period from ca. AD 910 to 990 was not only the driest period in the last 3,000 years, but also a persistently dry period [italics added]. And in further support of this interpretation, they note that the core section encompassing the Classic Maya collapse has the lowest sedimentation rate among all layers and the lowest oxygen isotope variability.
In one final study, working in the Sierra de Manantlan Biosphere Reserve (SMBR) in west-central Mexico, Figueroa-Rangel et al. (2010) constructed a 1300-year history of the reserves cloud forest vegetation dynamics via analyses of fossil pollen, microfossil charcoal and organic and inorganic sediment data obtained from a 96-cm core of black organic material retrieved from a small forest hollow (19°3532"N, 104°1656"W). In doing so the authors found that during intervals of aridity, cloud forest taxa tend to become reduced, while, in contrast, during intervals of increased humidity, the cloud forest thrives. And based on these facts, they determined from their data that there was a major dry period that lasted from approximately AD 800 to 1200 in the SMBR.
Quoting the four researchers, results from this study corroborate the existence of a dry period from 1200 to 800 cal years BP in mountain forests of the region (B.L. Figueroa-Rangel, unpublished data); in central Mexico (Metcalf and Hales, 1994; Metcalfe, 1995; Arnauld et al., 1997; OHara and Metcalfe, 1997; Almeida-Lenero et al., 2005; Ludlow-Wiechers et al., 2005; Metcalfe et al., 2007); lowlands of the Yucatan Peninsula (Hodell et al., 1995, 2001, 2005a,b) and the Cariaco Basin in Venezuela (Haug et al., 2003). In addition, they write that the causes associated to this phase of climate change have been attributed to solar activity (Hodell et al., 2001; Haug et al., 2003), changes in the latitudinal migration of the Intertropical Convergence Zone (ITCZ, Metcalfe et al., 2000; Hodell et al., 2005a,b; Berrio et al., 2006) and to ENSO variability (Metcalfe, 2006).
Based on the many results described above, it is evident that throughout much of Mexico some of the driest conditions and worst droughts of the Late Holocene occurred prior to the late 20th and early 21st centuries. These observations do much to discredit the climate-alarmist claim that droughts will only get worse as air temperatures rise, especially when it is realized that all of the Mexican droughts of the 20th century/early 21st century (when climate alarmists claim the planet warmed at a rate and to a level that were both unprecedented over the past two millennia) were much milder than many of the droughts that occurred during the much colder centuries of the Little Ice Age, as well as the warmer centuries of the Medieval Warm Period, the latter of which observations suggests that for climate-alarmists to be right about warmth causing droughts, they would have to admit that the Medieval Warm Period (which held sway from about AD 800-1300) was much warmer than anything earth has experienced over the past several decades, which, of course, they simply will not do.References
Almeida-Lenero, L., Hooghiemstra, H., Cleef, A.M. and Van Geel, B. 2005. Holocene climatic and environmental change from pollen records of Lakes Zempoala and Quila, central Mexican highlands. Review of Palaeobotany and Palynology 136: 63-92.
Arnauld, C., Metcalfe, S. and Petrequin, P. 1997. Holocene climatic change in the Zacapu Lake Basin, Michoacan: synthesis of results. Quaternary International 43/44: 173-179.
Berrio, J.C., Hooghiemstra, H., van Geel, B. and Ludlow-Wiechers, B. 2006. Environmental history of the dry forest biome of Guerrero, Mexico, and human impact during the last c. 2700 years. The Holocene 16: 63-80.
Cleaveland, M.K., Stahle, D.W., Therrell, M.D., Villanueva-Diaz, J. and Burns, B.T. 2003. Tree-ring reconstructed winter precipitation and tropical teleconnections in Durango, Mexico. Climatic Change 59: 369-388.
Curtis, J., Brenner, M., Hodell, D. Balser, R., Islebe, G.A. and Hooghiemstra, H. 1998. A multi-proxy study of Holocene environmental change in the Maya Lowlands of Peten Guatemala. Journal of Paleolimnology 19: 139-159.
Curtis, J., Hodell, D. and Brenner, M. 1996. Climate variability on the Yucatan Peninsula (Mexico) during the past 3500 years, and implications for Maya cultural evolution. Quaternary Research 46: 37-47.
Diaz, S.C., Therrell, M.D., Stahle, D.W. and Cleaveland, M.K. 2002. Chihuahua (Mexico) winter-spring precipitation reconstructed from tree-rings, 1647-1992. Climate Research 22: 237-244.
Dominguez-Vazquez, G. and Islebe, G.A. 2008. Protracted drought during the late Holocene in the Lacandon rain forest, Mexico. Vegetation History and Archaeobotany 17: 327-333.
Escobar, J., Curtis, J.H., Brenner, M., Hodell, D.A. and Holmes, J.A. 2010. Isotope measurements of single ostracod valves and gastropod shells for climate reconstruction: Evaluation of within-sample variability and determination of optimum sample size. Journal of Paleolimnology 43: 921-938.
Figueroa-Rangel, B.L., Willis, K.J. and Olvera-Vargas, M. 2010. Cloud forest dynamics in the Mexican neotropics during the last 1300 years. Global Change Biology 16: 1689-1704.
Haug, G.H., Gunther, D., Peterson, L.C., Sigman, D.M., Hughen, K.A. and Aeschlimann, B. 2003. Climate and the collapse of the Maya civilization. Science 299: 1731-1735.
Hodell, D.A., Brenner, M. and Curtis, J.H. 2005a. Terminal classic drought in the northern Maya lowlands inferred from multiple sediment cores in Lake Chichancanab (Mexico). Quaternary Science Reviews 24: 1413-1427.
Hodell, D.A., Brenner, M. and Curtis, J.H. 2007. Climate and cultural history of the Northeastern Yucatan Peninsula, Quintana Roo, Mexico. Climatic Change 83: 215-240.
Hodell, D.A., Brenner, M., Curtis, J.H. and Guilderson, T. 2001. Solar forcing of drought frequency in the Maya lowlands. Science 292: 1367-1369.
Hodell, D.A., Brenner, M., Curtis, J.H., Medina-Gonzalez, R., Can, E. I.-C., Albornaz-Pat, A. and Guilderson, T.P. 2005b. Climate change on the Yucatan Peninsula during the Little Ice Age. Quaternary Research 63: 109-121.
Hodell, D.A., Curtis, J. and Brenner, M. 1995. Possible role of climate in the collapse of classic Maya civilization. Nature 375: 391-394.
Lachniet, M.S., Burns, S.J., Piperno, D.R., Asmerom, Y., Polyak, V.J., Moy, C.M. and Christenson, K. 2004. A 1500-year El Niño/Southern Oscillation and rainfall history for the Isthmus of Panama from speleothem calcite. Journal of Geophysical Research 109: 10.1029/2004JD004694.
Ludlow-Wiechers, B., Almeida-Lenero, L. and Islebe, G. 2005. Paleoecological and climatic changes of the Upper Lerma Basin, Central Mexico during the Holocene. Quaternary Research 64: 318-332.
Lund, D.C. and Curry, W.B. 2004. Late Holocene variability in Florida Current surface density: patterns and possible causes. Paleoceanography 19: 10.1029/2004PA001008.
Metcalfe, S.E. 1995. Holocene environmental change in the Zacapu Basin, Mexico: a diatom based record. The Holocene 5: 196-208.
Metcalfe, S.E. 2006. Late Quaternary environments of the northern deserts and central transvolcanic belt of Mexico. Annals of the Missouri Botanical Garden 93: 258-273.
Metcalfe, S. E. and Davies, S.J. 2007. Deciphering recent climate change in central Mexican lake records. Climatic Change 83: 169-186.
Metcalfe, S.E., Davies, S.J., Braisby, J.D., Leng, M.J., Newton, A.J., Terrett, N.L. and OHara, S.L. 2007. Long-term changes in the Patzcuaro Basin, central Mexico. Palaeogeography, Palaeoclimatology, Palaeoecology 247: 272-295.
Metcalfe, S.E. and Hales, P.E. 1994. Holocene diatoms from a Mexican crater lakeLa Piscina Yuriria. In: Proceedings of the 11th International Diatom Symposium, San Francisco, USA, 1990 17: 155-171. California Academy of Sciences, San Francisco, California, USA.
Metcalfe, S.E., OHara, S.L., Caballero, M. and Davies, S.J. 2000. Records of Late Pleistocene-Holocene climatic change in Mexicoa review. Quaternary Science Reviews 19: 699-721.
Metcalfe, S.E., Street-Perrott, F.A., Perrott, R.A. and Harkness, D.D. 1991. Palaeolimnology of the Upper Lerma Basin, central Mexico: a record of climatic change and anthropogenic disturbance since 11,600 yr B.P. Journal of Paleolimnology 5: 197-218.
OHara, S.L. and Metcalfe, S.E. 1997. The climate of Mexico since the Aztec period. Quaternary International 43/44: 25-31.
Stahle, D.W., Cook, E.R., Cleaveland, M.K, Therrell, M.D., Meko, D.M., Grissino-Mayer, H.D., Watson, E. and Luckman, B.H. 2000. Tree-ring data document 16th century megadrought over North America. EOS, Transactions, American Geophysical Union 81: 121, 125.
Therrell, M.D., Stahle, D.W., Villanueva Diaz, J., Cornejo Oviedo, E.H. and Cleaveland, M.K. 2006. Tree-ring reconstructed maize yield in central Mexico: 1474-2001. Climatic Change 74: 493-504.
Watts, W.A. and Bradbury, J.P. 1982. Paleoecological studies at Lake Patzcuaro on the West Central Mexican plateau and at Chalco in the Basin of Mexico. Quaternary Research 17: 56-70.
See link
Jul 20, 2012
Tree rings suggest Roman world was warmer than thought
by Fred Pearce
How did the Romans manage to grow grapes in northern England when most climate studies suggest the weather was much cooler then? We may now have an answer: it wasnt that cold at all.
Long-term temperature reconstructions often rely on the width of tree rings: they assume that warmer summers make for wider rings. Using this measure, it seems that global temperatures changed very little over the past two millennia. Such studies are behind the famous hockey stick graph, created by Michael Mann of Pennsylvania State University in University Park, which shows stable temperatures for a millennium before the 20th century.
Jan Esper of Johannes Gutenberg University in Mainz, Germany, thinks that at least some of those tree rings actually show something else: a long-term cooling trend that lasted right up until the Industrial Revolution. The trend came about because of reduced solar heating caused by changes to the Earths orbit known as Milankovitch wobbles, says Esper. His results suggest the Roman world was 0.6 C warmer than previously thought enough to make grape vines in northern England a possibility.
Esper and his colleagues say that warmer summers do not necessarily make tree rings wider but they often make them denser. He studied the density of tree rings in hundreds of northern Scandinavian trees and found that they showed evidence of a gradual cooling trend that began around 2000 years ago.
The finding fits with other proxies for temperature - such as the chemical make-up of air trapped in glaciers and the organic remains in ancient lake sediments - which have also suggested a cooling trend.
Espers study is the latest to indicate that temperatures were less stable than originally thought. In 2009, Darrell Kaufman of Northern Arizona University at Flagstaff published evidence, using a range of proxies, that indicated a cooling in the Arctic for most of the past 2000 years (Science, DOI: 10.1126/science.1173983). Espers findings suggest that the cooling trend was even stronger than Kaufman concluded.
The finding does not change our understanding of the warming power of carbon dioxide. In fact, it shows that human CO2 emissions have interrupted a long cooling period that would ultimately have delivered the next ice age. (Have not heard that one before, stated so explicitly. BB)
Esper says temperature reconstructions will have to be redone because past studies probably underestimated temperatures during the medieval warm period and other warm periods going back to Roman times. The further back in time, the greater the underestimate would be.
But others have doubts. Mann argues that Espers tree-ring measurements come from high latitudes and reflect only summer temperatures. The implications of this study are vastly overstated by the authors, he says.
Journal reference: Nature Climate Change, DOI: 10.1038/nclimate1589
---------
Dear Mr. Pearce
Yesterday, whilst waiting for my wife to join me in Marks and Spencer, I chanced to glance at the latest edition of New Scientist, in which your contribution appears. I confess that, both for reasons of time and from a sense of disenchantment anyway with this populist rag, I did little more than skim read. However, I think that enough was gleaned legitimately to allow for comment.
The thrust of your piece was that the handle of the hockey stick was, in fact, correct. Somebodys recent study of tree rings had indicated that, whilst they might or might not be wider or narrower, much could be deduced from their density. From this it had been concluded that the past two thousand years had seen a warm temperature continuum of remarkable consistency up to about the middle of the 19th century, say. This, in turn, explained why our forebears had been able to cultivate vines as far North as York. Thence, the conclusion seemed to be drawn that Mann had been right all along in claiming a perilous temperature increase from roughly the advent of the Industrial Revolution, the blade.
Of course, MacIntyres undermining of Manns little frolic was not so much based upon scientific grounds although, God knows, there wasnt much science to it, as upon his blithe disregard for statistical rigour. You make no mention of this. Why, pray? Neither do you make any mention of Briffas equally egregious pseudo-science directed at sustaining the original Mann fiction. You also overlook circumstances that are richly supported by multi-stranded evidence.
Examples? Well, how about the fact that: even now viniculture is not pursued with much success in Northern latitudes in this country - or, indeed as far as I know, in any other, save where local topography is helpful, as in Germany, say; however warm the Medieval Warm Period may or may not have been, it was most surely followed by several centuries of real and readily perceptible cooling, to wit the Little Ice Age. For this latter, of course, there is a wealth of evidence not merely scientific but from the arts and historical records as well. Actually, in passing, the same may be said of the preceding MWP.
Furthermore, for somebody seeking to make the case that you appear to be advancing, the happenstance of both the MWP and of LIA is acknowledged both by NASA and the IPCC, not to mention that bastion of scientific rectitude, The Royal Society. So I think that it should be taken as accepted fact albeit, most assuredly, not specifically because it carries the endorsement of those particular bodies.
Would you not agree?
The point, of course, is that, if this be so, then where is Manns temperature continuum?
As a practising journalist, I presume that you would at least like to make some claim to being influenced by a measure of respect for objectivity. One wonders why then you continue so compulsively to try to defend the indefensible, and give credence to a manifest scientific mountebank.
ATB
ICECAP
Join our efforts to Secure America's Borders and End Illegal Immigration by Joining ALIPAC's E-Mail Alerts network (CLICK HERE)
-
11-24-2012, 03:39 PM #19Senior Member
- Join Date
- May 2007
- Location
- South West Florida (Behind friendly lines but still in Occupied Territory)
- Posts
- 117,696
Jul 20, 2012
Oh Great: US geoengineers to spray sun-reflecting chemicals from balloon
Source: Business Green
Two Harvard engineers are planning to spray thousands of tonnes of sun-reflecting chemical particles into the atmosphere to artificially cool the planet, using a balloon flying 80,000 feet over Fort Sumner, New Mexico.
The field experiment in solar geoengineering aims to ultimately create a technology to replicate the observed effects of volcanoes that spew sulphates into the stratosphere, using sulphate aerosols to bounce sunlight back to space and decrease the temperature of the Earth.
David Keith, one of the investigators, has argued that solar geoengineering could be an inexpensive method to slow down global warming, but other scientists warn that it could have unpredictable, disastrous consequences for the Earth’s weather systems and food supplies. Environmental groups fear that the push to make geoengineering a “plan B” for climate change will undermine efforts to reduce carbon emissions.
Keith, who manages a multimillion dollar geoengineering research fund provided by Microsoft founder Bill Gates, previously commissioned a study by a US aerospace company that made the case for the feasibility of large-scale deployment of solar geoengineering technologies.
His US experiment, conducted with American James Anderson, will take place within a year and involve the release of tens or hundreds of kilograms of particles to measure the impacts on ozone chemistry, and to test ways to make sulphate aerosols the appropriate size. Since it is impossible to simulate the complexity of the stratosphere in a laboratory, Keith says the experiment will provide an opportunity to improve models of how the ozone layer could be altered by much larger-scale sulphate spraying.
“The objective is not to alter the climate, but simply to probe the processes at a micro scale,” said Keith. “The direct risk is very small.”
While the experiment may not harm the climate, environmental groups say that the global environmental risks of solar geoengineering have been amply identified through modelling and the study of the impacts of sulphuric dust emitted by volcanoes.
“Impacts include the potential for further damage to the ozone layer, and disruption of rainfall, particularly in tropical and subtropical regions - potentially threatening the food supplies of billions of people,” said Pat Mooney, executive director of the Canadian-based technology watchdog ETC Group. “It will do nothing to decrease levels of greenhouse gases in the atmosphere or halt ocean acidification. And solar geoengineering is likely to increase the risk of climate-related international conflict - given that the modelling to date shows it poses greater risks to the global south.”
A scientific study published last month concluded that solar radiation management could decrease rainfall by 15 per cent in areas of North America and northern Eurasia and by more than 20 per cent in central South America.
Last autumn, a British field test of a balloon-and-hosepipe device that would have pumped water into the sky generated controversy. The government-funded project - Stratospheric Particle Injection for Climate Engineering (Spice) - was cancelled after a row over patents and a public outcry by global NGOs, some of whom argued the project was a “Trojan horse” that would open the door to full-scale deployment of the technology.
Keith said he opposed Spice from the outset because it would not have improved knowledge of the risks or effectiveness of solar geoengineering, unlike his own experiment.
“I salute the British government for getting out and trying something,” he said. “But I wish they’d had a better process, because those opposed to any such experiments will see it as a victory and try to stop other experiments as well.”
The Guardian understands that Keith is planning to use the Gates-backed fund to organise a meeting to study the lessons of Spice.
Enlarged
Jul 15, 2012
Extreme Global Warming: NOAA Confirms Modern U.S. Warming Not As Hot vs. 1930s
C3 Headlines
The recent toasty 2012 summer weather experienced in the U.S. has the climate doomsday pundits again claiming that extreme global warming (EGW) is to blame - however, NOAA’s NCDC climate research agency has recently documented that EGW for the U.S. over the last decade was AWOL. (click images to enlarge)
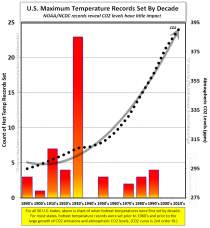
Read here. The NCDC, a NOAA climate research unit, recently published a new dataset compiling U.S. weather records, including the maximum temperature record for each state. (Interestingly, the NCDC refers to these as ‘climate extremes’ - to the casual observer, it would be more accurate to refer to them as ‘weather extremes.’
The adjacent chart shows when those maximum temperature records were initially set, by decade. In addition, the black dots represent the average CO2 level by decade. [Update 7/15/12: We were notified by ‘C3’ reader that chart had mistake, and we confirmed - the 1930’s had 24 maximum temperature records, not 23; the 1990’s actually had 3, not 4 as shown in the chart]
“It also is useful for putting the recent heat wave in perspective. Despite the 24/7 caterwauling, only two new state records - South Carolina and Georgia- are currently under investigation. And, looking carefully at Shein et al. dataset, there appears to be a remarkable lack of all-time records in recent years. This is particularly striking given the increasing urbanization of the U.S. and the consequent “non climatic” warming that creeps into previously pristine records. Everything else being equal-and with no warming from increased greenhouse gases- most statewide records should be in or near big cities. But they aren’t.”
Per NOAA, 82% of all maximum records were initially set prior to 1960 and prior to the accelerated growth of human CO2 emissions and atmospheric CO2 levels.
As can be seen, through 2011, no maximum temperature records have been set since the 1990’s. This is simply amazing since all the climate doomsday scientists and pundits have stated that recent global warming was “unprecedented” and that U.S. temperatures were rapidly increasing due to CO2 levels.
Based on the hysterical hyperbole from mainstream media sources, one would naturally have expected that many new maximum temperature records would have been set (not tied) since 1999.
Alas, it did not happen. Therefore, one can conclude that the U.S. was overdue for some record-setting temperatures and should be expected in the very near future.
As if on cue, the 2012 hot summer arrived in the U.S. and it’s highly likely some new state maximum temperature records were set. Again, this should not be a surprise since a hot summer was overdue. And it most certainly was not a result of high CO2 levels.
Objectively, if high CO2 levels are primarily responsible for record maximum temperatures, than the past U.S. records prior to 1960 fully refute that speculative hypothesis.
This next chart lists each U.S. state and when its maximum temperature record was initially set, and includes those years when it was tied.
It’s especially interesting to note that there was just one state, and a single year (2006), where a previous maximum temperature record was reached.
Additionally, during the Super El Nino of 1998, not a single maximum temperature record was broken or reached, which is incredibly mind-boggling when one considers the combination of an extreme ENSO phase with high CO2 levels.
Conclusions: Despite the incredible growth of CO2 levels since 1960, the vast majority of U.S. extreme global warming took place pre-1960. Based on NOAA historical observations and expectations, the U.S. was due for a summer of record-setting temperatures regardless of CO2 levels - the 2012 hot summer may indeed tie old records and set new ones. And finally, the 1890’s to 1930’s were decades of extreme heat in the U.S., with the majority of state maximum temperature records being set during that period - climate doomsday scientists have no believable theory to explain such extreme global warming with such low CO2 levels.
Icecap Note: This confirms the study by Bruce Hall using NCDC Monthly State Records (50 states times 12 months or 600 data points).
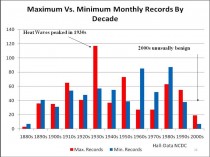
Enlarged
Jul 07, 2012
Sunday Reflection: The collusion of the climate crowd
Christopher C. Horner, OpEd Contributor, The Washington Examiner
Not long ago, the American Tradition Institute initiated a transparency campaign using federal and state freedom of information laws to learn more about how taxpayer-funded academics use their positions to advance a particular agenda. On its face, this should have been welcomed by the Left, which often lays claim to the “transparency” mantle. It is instead causing great angst.
Our project would compile the context to the “Climategate” scandal, which, as activist academics central to its revelations assured us, was really an out-of-context misrepresentation. Curiously, the same people think this project a very bad idea.
So do the media and environmentalist establishments. Of the latter, the Union of Concerned Scientists became particularly exercised, mobilizing left-wing groups to urge universities not to satisfy our requests for public documents.
None of these groups, incidentally, was troubled by a series of similar requests by Greenpeace, whose effort we replicated. They only became opposed when we sought the emails of the sort of activists with whom they work.
Some of these, recently obtained from Texas A&M University, provide one explanation for this reversal.
For example, they reveal a sophisticated UCS operation to assist activist academics and other government employees as authorities for promoting UCS’s agenda. This includes “moot-courting” congressional hearings with a team of UCS staff, all the way down to providing dossiers on key committee members, addressing in particular their faith, stance on gay marriage and stimulus spending. Of course.
This also includes directing the taxpayers’ servants to outside PR consultants—apparently pro bono or else on UCS’s dime. Keep this last point in mind.
They also expose the New York Times reporter who covers the environment, science and specifically the global warming issue, Justin Gillis, as being no disinterested party. Gillis wrote a piece in May laboring to undermine one of the most highly credentialed and respected climate “skeptics,” the Massachusetts Institute of Technology’s Dr. Richard Lindzen. This front-page article prompted my request for information reflecting how the A&M professor and activist whom Gillis quoted was using his taxpayer-funded position.
The specific correspondence began when Gillis wrote that interviewing Lindzen for a piece on his area of expertise was “unavoidable,” and “[s]o I need a really good bibliography of all the published science” countering Lindzen’s position on cloud feedback—“that is, anything that stands as evidence against Lindzen’s claim that the feedback has to be strongly negative.”
Remember, this was a reporter for the New York Times writing this. In the released emails, Gillis comes off as an activist posing as a journalist, sneering at Lindzen. Of another prominent skeptic, Gillis wrote, “I sense you’ve got him in a trap here ... can’t wait to see it sprung.” (Ellipses in original.)
Our transparency campaign caused much wailing and gnashing of teeth among academia and its affiliated societies, the Washington Post, and the American Constitution Society. They joined UCS to attest that these sacrosanct exchanges of ideas would be fatally chilled if not granted an unlegislated exemption from freedom of information laws.
So you might be surprised to learn that the Texas A&M email production shows the academics actually forwarding their email discussions outside their circle. To New York Times reporters, for example. They even often copy reporters on the very exchanges they otherwise insist represent an intellectual circle that must remain free from violation by prying, nonacademic eyes.
Awkward.
Following my Texas A&M request, a producer contacted me from “Frontline,” a PBS program known for grinding liberal axes. She wanted to discuss our Freedom of Information Act litigation. As we are currently only involved in the high-profile case involving the University of Virginia’s Climategate records, I referred her to lead counsel.
It turns out she was really interested in records requests with two different, more cooperative schools: the Texas A&M request, and one I filed at Texas Tech University. The latter sought a professor and climate activist’s correspondence about a chapter she was writing for Newt Gingrich’s upcoming book. (Naturally, this Texas Tech professor who opposed providing me the emails had already provided them to a Los Angeles Times reporter.)
Now, you might ask, how would two otherwise fairly obscure Texas activists become the subject of interest to “Frontline”? That brings us back to UCS.
One of the emails produced by Texas A&M shows its activist contacting, and being given advice by, a D.C. media consultant, Richard Ades of Prism Public Affairs, “a strategic communications firm that operates at the intersection of public policy and the media” according to its website. The professor says he was referred by Aaron Huertas of UCS.
I have sent two other public records requests following up on these points. Expect the usual suspects to respond in their usual way. The media, academia and environmentalist pressure groups share an agenda, and work closely together to advance it. Remember this when these interests assail efforts to obtain public records shedding light on these activities.
Christopher C. Horner is director of litigation for the American Tradition Institute and author of the forthcoming book “The Liberal War on Transparency: Confessions of a Freedom of Information ‘Criminal’ “ (Threshold).
ICECAP
Join our efforts to Secure America's Borders and End Illegal Immigration by Joining ALIPAC's E-Mail Alerts network (CLICK HERE)
-
11-24-2012, 03:41 PM #20Senior Member
- Join Date
- May 2007
- Location
- South West Florida (Behind friendly lines but still in Occupied Territory)
- Posts
- 117,696
Jul 03, 2012
Climate Scientists Ripping-Off The U.S. Taxpayer? Lonnie Thompson & Ellen Mosley-Thompson
C3 Headlines
Billions have been invested in climate science research by the American taxpayers with the expectations that climate scientists would produce results that would become part of the public record - but some scientists appear to be ethically-challenged

(click to enlarge, source)
Read here. Its a great lifetime gig if one is comfortable by making a career of ripping-off the U.S. taxpayer. Just get the taxpayer to repeatedly fund your climate science research trips, literally from Pole-to-Pole, and then just conveniently forget to produce the scientific results in the manner required by Federal policies. And, by the way, dont worry your pretty little head because neither the science bureaucrats, nor the appropriate Federal agencies (hmmm....the IRS?), nor any spineless politico will actually challenge your perpetual forgetfulness or your ethical and moral compass.
Steve McIntyre of Climate Audit very bluntly describes how the Thompson scientists have been doing this for decades and the public has nothing in return other than some basic ice core squiggle charts, like the one above.
What are they required to produce if funded by the Feds?
...despite clear U.S. federal government policies dating back to 1991 which, on paper, require thorough data archiving by the climate community as a condition of receiving grants.
Full and open sharing of the full suite of global data sets for all global change researchers is a fundamental objective. As data are made available, global change researchers should have full and open access to them without restrictions on research use...
The data products and their metadata will be provided in a standard exchange format no later than the grant final report or the publication of the data products associated results, whichever comes first.
And what did the public and science community receive instead?
Unfortunately, the U.S. climate funding bureaucracy has been thoroughly co-opted by the climate industry and has failed to enforce regulations that, on paper, would require the Thompsons and others to archive data.
While Lonnie Thompson has been a frequent example at Climate Audit of a serial non-archiver, it turns out that Ellen Mosley-Thompson is even worse. Mrs Lonnie has spent her entire career in the ice core business. According to her CV, she has led nine expeditions to Antarctica and six to Greenland to retrieve ice cores. However, a search of the NOAA paleo archive for data archived by Mrs Lonnie shows only one data set from Antarctica or Greenland associated with her. Lest this example be taken to mar her otherwise unblemished record of non-archiving, the data was published in 1981 while she was still junior...I believe that its fair that she has not archived at NOAA (or, to my knowledge, elsewhere) any data from the nine expeditions to Antarctica and six to Greenland.
Squiggles for 6 of Mrs Lonnies Greenland cores (5 PARCA and one 1989 core) and 3 of her Antarctic cores (dating back to the early 1990s) were shown in a 2006 article. None of this data has been archived.
The total failure of the PARCA program to archive a single d1 measurement is really quite remarkable.
As we said, a great lifetime gig if one has no conscience or scruples.
Honestly, is it any wonder why the public has such low regard for the climate science community? Is it really that difficult for the academia and government elites to understand why the publics trust in science has faded in recent years when this type of crap happens and officials keep condoning these Federal science rip-offs?
Jul 01, 2012
Is there a derecho in here?
By Joe DAleo
The Storm Prediction Center continued to receive damaging wind reports Saturday and upped the total for the derecho to 1060.
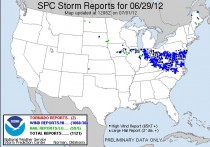
Enlarged
The storms fed off the intense heat in the heat ridge and bowed out Friday and expanded as it crossed Ohio and West Virginia into Virginia including the nations capitol.
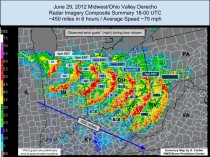
Enlarged
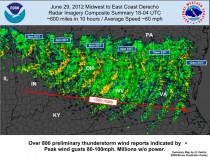
Enlarged
It delivered needed rains for the northern Ohio Valley and doused the extreme heat for Saturday. But a literal drop in the bucket this very dry year.
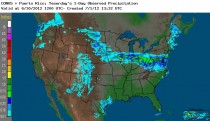
Enlarged
WHAT IS A DERECHO?
A derecho is a long-lived straight line wind storm. The word derecho comes from the Spanish word meaning straight. These storms are generally associated with severe thunderstorms and occur most frequently along a squall line, especially in bowing sections. This means that while most of the line may be straight, there will be areas that bow out. It is in these areas, where we see the strongest winds and derechos occur. Derechos are most common in the summer months, but can occur at any time of the year and at any time of the day. Derechos can travel for several hundred miles and can typically last for over six hours.
Derechos differ from typical severe thunderstorms in several ways. One, derechos move at a rate of increasing forward speed. Secondly, derechos are unusually long, typically about 250 miles in length. The maximum winds within derechos are typically in excess of 80 or even 100mph. Derechos rarely form tornadoes, most of the damage is caused by straight line winds.
One of the most famous derecho events include the Memphis Summer Storm of 2003, which is also known as Hurricane Elvis. The storm hit Memphis with winds will over 100mph killing seven and leaving over 300,000 people without power for up to two weeks.
The term derecho has been around for a long time. It was first described by Gustavus Hinrichs in 1888. The term was later revived by Robert Johns and William Hirt in 1987. Although derechos in other countries can happen, Johns and Hirt identify areas from the upper Midwest to the Ohio valley as particularly prone to these wind events. Occasionally, these storms will move into the Appalachia regions.
Dr. Ted Fujita first coined the term bow echo to describe the bow shaped path of mesoscale convective systems (thunderstorms). Derechos usually evolve from a bow echo formation and have become somewhat synonymous with the term long-lived bow echo. The storm that caused Fujita to coin the term bow echo had a derecho event that affected Northern Wisconsin known as the The Independence Day Derecho of 1977.
CLIMATOLOGY OF DERECHOES
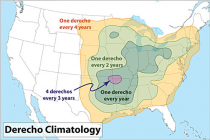
Enlarged
THE GREAT ADIRONDACK DERECHO OF 1995 (NOAA)
THE JULY 15 1995 DERECHO THAT RAVAGED MUCH OF EASTERN NEW YORK AND WESTERN NEW ENGLAND. A DERECHO IS A WIDESPREAD AND LONG LIVED WINDSTORM THAT IS ASSOCIATED WITH A BAND OF RAPIDLY MOVING THUNDERSTORMS.
IN 1995...A LINE OF DAMAGING THUNDERSTORMS DEVELOPED IN THE NORTHERN GREAT LAKES DURING THE NIGHT OF JULY 14 AND QUICKLY STRENGTHENED AS IT MOVED INTO NORTHERN NEW YORK BY 4 AM ON JULY 15...AND THEN INTO SOUTHERN NEW ENGLAND BY 8 AM. ESTIMATED PEAK WIND SPEEDS IN EXCESS OF 100 MPH OCCURRED IN THE ADIRONDACKS AND THE STORMS THEMSELVES COVERED OVER 800 MILES (FROM ONTARIO PROVINCE TO CAPE COD) IN LESS THAN 12 HOURS...MOVING AT AN AVERAGE FORWARD SPEED OF 67 MPH.
THIS DERECHO RESULTED IN FIVE DEATHS AND 11 INJURIES AND CAUSED DAMAGE TO NEARLY ONE MILLION ACRES OF TREES IN THE ADIRONDACKS. ALSO, IT WAS ONE OF THE COSTLIEST WINDSTORMS IN EASTERN NORTH AMERICA...WITH NEARLY A HALF BILLION DOLLARS IN DAMAGES.
That heat wave summer produced 4 derechos as outlines by NOAA here.
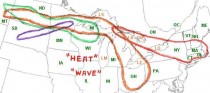
Enlarged
The Ontario-Adirondacks Derecho of July 14 and 15, 1995
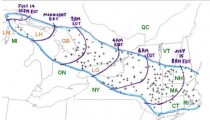
Map of the Ontario-Adirondacks Derecho (courtesy of NOAA)
The Ontario-Adirondacks Derecho got its start near the straits of Mackinac on Friday evening July 14, 1995. At the Mackinac Bridge connecting the Upper and Lower Peninsulas of Michigan, 100 mph winds were detected and sustained winds above 80 mph continued on the bridge for 10 additional minutes. After crossing the open waters of Lake Huron/Georgian Bay, the storm raced southeastward into central southern Ontario. Several brief tornadoes were reported. An F1 tornado struck the Balsam Lake Trailer Park near Kirkfield, flipping over vehicles, destroying several trailers and sending ten people to hospital with non life-threatening injuries. One trailer was thrown over 250 meters. Across the lake from the trailer park, straightline winds caused extensive damage in the cottage community of Long Point. Further east, near Peterborough, an F2 tornado hit Bridgenorth damaging or destroying 20 homes and a marina with winds estimated upward of 200 km/h (120 mph/h). To get an idea of the straight line wind damage over a wide area, a sustained wind gust of 136 km/h (84 mp/h) was recorded just north of Toronto at the Buttonville Airport, which was located on the far southern periphery of the main derecho.
Many thousands of trees were blown down across the province severing power lines, blocking roadways, and damaging homes. One person was killed, and dozens of people were injured. Eight people trapped in flipped houseboat in Pigeon Lake near Peterborough were rescued hours after the storm. Power was not restored to some affected areas for up to a week after the event. The derecho caused $53 million in damage (Canadian dollars).
The storm entered New York state at around 4 A.M. The storm slammed into the Adirondacks felling 900,000 acres (3,600 km²) of forest. The value of the loss of timber was estimated at over $200 million (1995 dollars).
The derecho passed through the Syracuse airport with a 76 mph wind gust. A parked Boeing 727 was blown into another plane. A 77 mph wind gust was recorded at Albany. It moved into New England a little after sunrise producing 70-90 mph wind gusts in several towns in Massachusetts. Fifty people were left homeless after the derecho blew the roof of an apartment building in Holyoke, Massachusetts.
The Ontario-Adirondacks Derecho was the strongest of the Derecho events of the previous days and is among the costliest thunderstorms in US/Canadian history. It caused $500 million US dollars in damage. Altogether, the four derecho events caused nearly $1 billion in damage.
Another Derecho was captured in picture by David Berry on a bow echo derecho on May 27, 2001 and posted on the SPC site. Dave was located at the big X at the time of the photo, which he appropriately named Mothership.
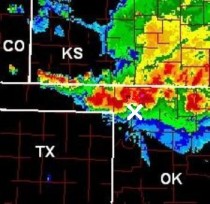
Enlarged
Enlarged
Like in 1995, as long as the heat ridge continues shuttling back and forth, we are subject to more ring-of-fire convection, thunderstorm complexes and yes derechos.
By the way. Joe Bastardi and I do stories like this (and videos) daily for our premium clients at Weatherbell (weatherbell.com) and our staff of 4 meteorologists provide detailed forecasts for energy, ag, insurance, marine and retail. Dr. Ryan Maue has joined us and is putting together a dynamite model product page and will do some posting on hurricanes and climate. We have a top notch former TV meteorologist and PSU grad and an energy market analyst. Please join us and help us grow to do more.
Jun 29, 2012
Cooler Heads Digest - News of the Week
William Yeatman, Cooler Heads Digest
D.C. Circuit Court Rejects Challenge to EPAs Climate Regs
The federal D. C. Circuit Court of Appeals on June 26 dismissed all challenges to the Environmental Protection Agencys December 2009 finding that greenhouse gas emissions endanger human health and welfare and therefore can be regulated under the Clean Air Act.
The three-judge panel, which included Chief Judge David Sentelle, who was appointed by President Reagan, ruled unanimously that the endangerment finding and the tailpipe rule setting emissions standards for vehicles complied with the Administrative Procedures Act and that the EPAs implementation of the Clean Air Act is unambiguously correct.
The court did not rule on the merits of the tailoring rule and the timing rule, but instead dismissed the case on the grounds that none of the many plaintiffs in the combined suit has standing to sue. The petitioners lack standing because they failed to prove any injury to themselves caused by the rules.
The ruling was especially scathing in dismissing the arguments by the plaintiffs that the EPA had not made a compelling scientific case that greenhouse gas emissions pose a threat to human health and had relied too much on the dubious compilations of the U. N. Intergovernmental Panel on Climate Change. This is how science works. EPA is not required to re-prove the existence of the atom every time it approaches a scientific question.
The House of Representatives on April 7, 2011 voted 255 to 172 to overturn the endangerment finding. The Senate defeated a similar provision by a 50-50 vote on April 6, 2011.
My CEI colleague Marlo Lewis discusses attorney Peter Glasers analysis of the court ruling here.
Regional Cap-and-Trade in West Dwindles to One Participant
In 2007, the Western Climate Initiative was formed by seven States and four Canadian provinces, in order to develop a regional cap-and-trade energy rationing scheme. Since then, Arizona, New Mexico, Washington, Oregon, Montana, Utah, British Columbia, Manitoba, and Ontario have dropped out, leaving only California and Quebec working towards a launch of the WCI cap-and-trade this November. Yesterday, however, Quebec regulators announced that the Province would not be ready until Spring 2013, at the earliest. That means that California will have to go it alone. According to a report issued recently by Manufacturers and Technology Association, Californias cap-and-trade scheme will cost industry between $3.4 billion and $7.8 billion each year.
EPA Regs Threaten Texas with Blackouts
The Texas Public Utilities Commission this week approved a 50 percent increase in electricity rates that utilities can charge during times of peak demand. The measure is intended to improve the reliability of the states electricity grid, which has been rendered vulnerable to rolling blackouts by two forces: (1) EPA regulations that are shutting down coal-fired power plants and (2) the state governments support of mandates and subsidies for intermittent, unreliable wind power.
Pickens Plan, RIP
The chief House sponsor of the T. Boone Pickens Payoff Plan, Representative John Sullivan (R-Okla.) was defeated by political newcomer Jim Bridenstine in Oklahomas Republican primary elections on June 26. As my CEI colleague Brian McGraw notes in a post on GlobalWarming.org, the major policy disagreement between the two candidates was over Sullivans bill to provide billions of dollars of taxpayer subsidies to billionaire oilman T. Boone Pickens.
Here is the Tulsa Worlds description of a recent campaign debate between Sullivan and Bridenstine: On only one issue, energy policy, did Sullivan and Bridenstine substantially disagree. Sullivan touted his bill to promote natural gas vehicle fuels, while Bridenstine supports an alternative proposal. Bridenstine calls Sullivans NATGAS Act a big-government boondoggle because it creates a short-term subsidy to convert vehicles to natural gas. We ought not let Washington, D.C., control free markets with tax subsidies, he said.
ICECAPJoin our efforts to Secure America's Borders and End Illegal Immigration by Joining ALIPAC's E-Mail Alerts network (CLICK HERE)


 Reply With Quote

Watch: Paul, Hawley Torch Mayorkas To His Face On Laken Riley's...
04-19-2024, 02:32 PM in illegal immigration News Stories & Reports