Results 1 to 2 of 2
Thread Information
Users Browsing this Thread
There are currently 1 users browsing this thread. (0 members and 1 guests)
-
03-09-2011, 02:54 AM #1Senior Member


- Join Date
- May 2007
- Location
- South West Florida (Behind friendly lines but still in Occupied Territory)
- Posts
- 117,696
Speculators Bet Billions Shorting the U.S. Dollar
Crude Oil and Gold Prices Surge as Speculators Bet Billions Shorting the U.S. Dollar
Currencies / US Dollar
Mar 08, 2011 - 06:13 AM
By: Money_Morning
Kerri Shannon writes: Oil reached a 29-month high (yesterday) Monday morning in London and gold hit an intraday record as investors sought to hedge against inflation and traders bet billions shorting the dollar.
Brent crude futures contracts in London gained 0.1% yesterday to close at $116.11 a barrel, pushed higher by the Middle East crisis disrupting the oil supply. Crude for April delivery was up 0.9% to $105.36 in Monday afternoon trading on the New York Mercantile Exchange (NYMEX).
Fighting in Libya so far has reduced the country's oil output by 1 million barrels per day.
Libya's oil outflows will continue to decline as major U.S. oil companies have stopped trading with the country due to U.S. sanctions. Exxon Mobil Corp. (NYSE: XOM) and Morgan Stanley (NYSE: MS) announced they had stopped trades with Libya, and ConocoPhillips (NYSE: COP) said it was no longer exporting oil from the country.
Besides supply constraints, speculators have proved to be another driving force behind surging oil prices.
Speculators bet that oil will continue to power into the triple digits and have poured billions into oil futures. Investors last week bought 50,200 more contracts in West Texas Intermediate (WTI) crude. That brought the total number of futures contracts to 268,622, representing nearly 269 million barrels.
That's six times as much oil as can be stored at the WTI trading hub, according to Stephen Schork of the energy markets newsletter The Schork Report.
"It does not get any clearer which way Wall Street is trying to take oil," Schork wrote.
Analysts from Commerzbank AG (ETR: CBK) forecast Monday that WTI crude will average $107 in the second quarter, pushing gasoline prices closer to $4.00 a gallon. The national average for regular gasoline hit $3.38 a gallon on Feb. 28, up from $2.70 a year prior, according to the U.S. Energy Information Administration.
To protect the U.S. economic recovery, the Obama administration may tap U.S. oil reserves to combat rising crude prices. The 727-million-barrel emergency reserves are rarely tapped and have only been used twice in the past 20 years.
Consumer fears over high oil and gasoline prices pushed investors toward gold, which started the week hitting a record spot price of $1,444.40 an ounce. Silver also hit a 31-year high of $36.70 an ounce. Investors have turned to the precious metals as a hedge against inflation, their interest boosting prices even higher.
"The geopolitical risk premium is clearly reflected in the gold price," Robin Bhar, an analyst at Credit Agricole SA (EPA: ACA) told Reuters. "The violence (has) intensified, which does prompt suggestions of civil war in Libya."
Commodities were up overall as cotton led the sector higher, rising a daily limit of seven cents, or 3.3%, to hit a record $2.197 a pound.
Speculators driving up commodities prices could put the brakes on a U.S. economic recovery for the rest of 2011.
"Our analysis shows the maximum impact of oil on growth occurring with a lag of 3-4 quarters, which would point to a peak impact in late 2011," Goldman Sachs Group Inc. (NYSE: GS) analyst Jan Hatzius wrote in a note to clients last week.
Driving Down the Dollar
Speculators hit the currency markets and have thrown down record amounts of money against the U.S. dollar by short selling the currency.
"We may be seeing a turn in the longer-term outlook for the dollar - for the worse," Kit Juckes, head of foreign exchange strategy at Société Générale, told The Financial Times.
The U.S. Federal Reserve's easy money policies and the more than $14 trillion in U.S. debt have helped lead investors away from the dollar. Short dollar positions climbed to 281,088 contracts the week of March 1 from 200,564 the week ending Feb. 22, according to figures from the Chicago Mercantile Exchange (CME).
That puts the value of bets against the dollar on the CME to a record high of $39 billion, up 30% from the week prior.
The dollar index, with compares the dollar to a basket of six other currencies, fell to a four-month low Monday, down 0.2% to 76.215.
Investors are also more optimistic on the euro's prospects versus the dollar than they were months ago. The currency last week rose to a four-month high against the dollar of $1.3997, up nearly 9% from January.
"Dollar bears have become a marauding horde," David Watt, an analyst with RBC Capital Markets, told The FT.
Speculators favoring the euro over the dollar raised euro bets on the CME to $8.8 billion in the week ending March 1, the largest value since January 2008.
Investors expect the European Central Bank (ECB) to tighten its monetary policy and raise interest rates to curb rising inflation. ECB President Jean-Claude Trichet hinted last week that the bank could raise rates at its April meeting.
"Interest rates are set to remain a solid support for the euro against the dollar this year. We see the euro at $1.50 towards the end of the year," Jane Foley at Rabobank Group told The FT.
The euro betting marks a stark reversal from last year, when investors worried that the European sovereign debt crisis would cause a euro collapse.
Source : http://moneymorning.com/2011/03/08/oil- ... he-dollar/
Money Morning/The Money Map Report
http://www.marketoracle.co.uk/Article26775.htmlJoin our efforts to Secure America's Borders and End Illegal Immigration by Joining ALIPAC's E-Mail Alerts network (CLICK HERE)
-
03-09-2011, 03:18 AM #2Senior Member


- Join Date
- May 2007
- Location
- South West Florida (Behind friendly lines but still in Occupied Territory)
- Posts
- 117,696
U.S. Dollar Index at High Risk of Unraveling
Currencies / US Dollar
Mar 07, 2011 - 12:39 PM
By: Guy_Lerner
I am sure that you are aware that the Dollar Index can't get a bid. This isn't news but a fact. The Dollar Index is in a down trend, and the question to ponder is: how low can it go? Looking at the price patterns, I believe the Dollar is at significant risk of unraveling.
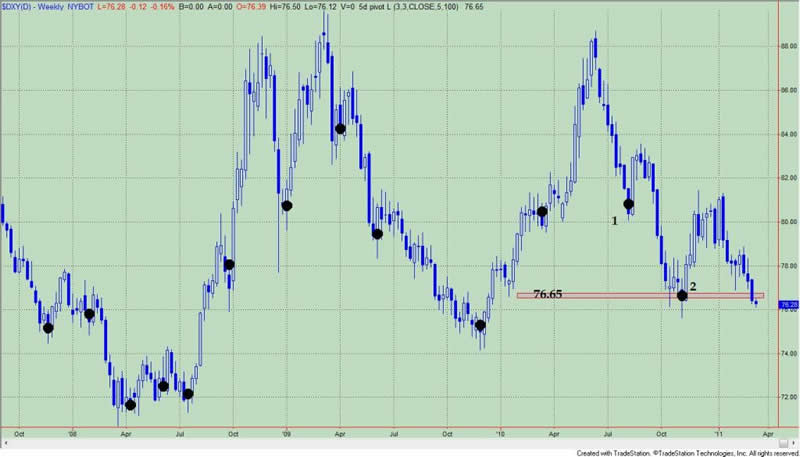
Figure 1 is a weekly chart of the Dollar Index (symbol: $DXY). The black dots over the price bars are pivot points, and as we can see, price closed last week below the two most recent pivot points (labeled 1 and 2). To understand the significance of this occurrence, let's design a study where we sell short the Dollar Index when the Dollar Index closes below two weekly pivot points. We will exit our positions after holding for 13 weeks. Commissions and slippage are not considered, and all signals are executed at the close. We will be looking at price data going back to 1974. The purpose here isn't to design a trading strategy, but to understand how the current price action could lead to a significant decline in the Dollar Index over the next 13 weeks.
Figure 1. $DXY/ weekly

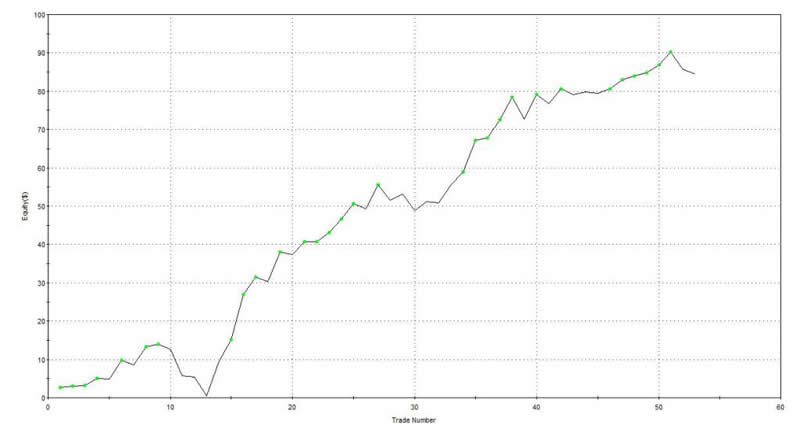
Since 1974, this strategy produced 53 trades with 66% being profitable. The strategy generated 84 Dollar Index points; over this time period, the Dollar Index has lost a negative 22 points. The equity curve for this strategy is shown in figure 2, and essentially, this is the type of equity curve that you want to see when designing a strategy -- a nice persistent, consistent upward sloping rise.
Figure 2. Equity Curve

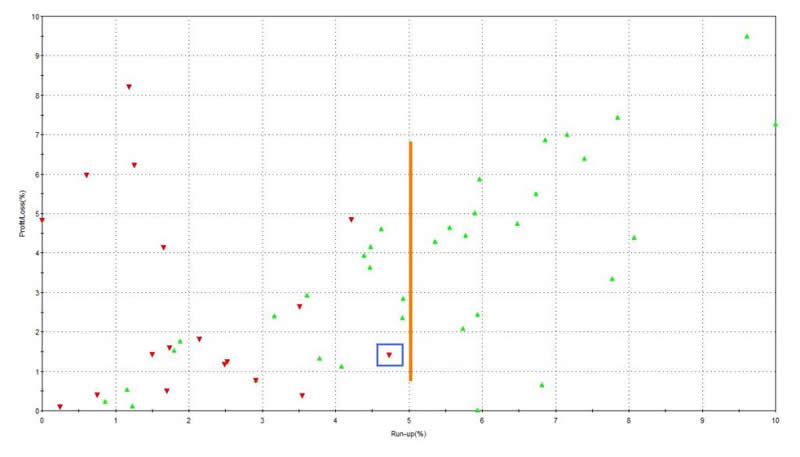
But as stated, we aren't trying to design a trading strategy, but we would like to determine when the Dollar Index might be at risk for sustainable and significant losses. To do this we need to look at the maximum favorable excursion (MFE) graph (see figure 3) from this strategy.
Figure 3. MFE graph

What is MFE? MFE looks at every trade from a strategy, and it assesses how far a trade moved in a profitable direction before being closed out for a profit or a loss. Looking at the trade inside the blue box in figure 3, we note that it had a run up or profit of 4.7% (x- axis) but it was closed out for a 1.4% loss (y- axis). We know that it was a losing trade because the caret is red. So what is the MFE graph for this strategy telling us? 18 out of the 53 trades (33%) had an MFE over 5%. (This is to the right of the orange line on the graph.) In other words, 13 weeks after this pattern is recognized, there is a 33% chance of a significant loss in the Dollar Index.
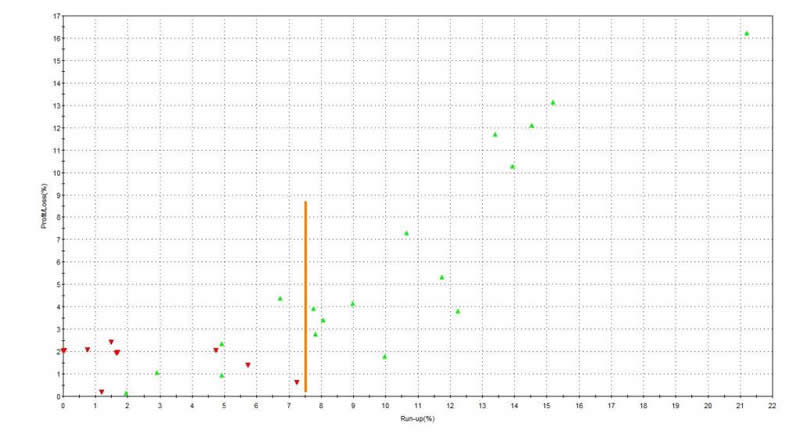
Rather than using a time stop (i.e., 13 weeks), let's cover our positions when price closes above two prior pivot points. This is the mirror image of our entry, and in this case, we are letting price (not time) take us out of the market. In this strategy, there were 28 trades and 64% were profitable. This strategy yielded 95 $DXY points since 1974. The average trade lasted 27 weeks, which is twice as long as the above study. If you remain in the market longer and allow price to take you out of the market, you get the MFE graph shown in figure 4.
Figure 4. MFE graph

13 out 28 trades had an MFE (or run up) greater than 7.5%. (This is to the right of the orange line). 9 out of 28 trades had an MFE greater than 10%.
So what is the bottom line? A close below two pivot points on a weekly chart puts the Dollar Index at a high risk of unraveling.
Later in the week, I will have more on the Dollar Index, plus I will consider the impact of a falling Dollar on equities and commodities.
By Guy Lerner
http://thetechnicaltakedotcom.blogspot.com/
http://www.marketoracle.co.uk/Article26759.htmlJoin our efforts to Secure America's Borders and End Illegal Immigration by Joining ALIPAC's E-Mail Alerts network (CLICK HERE)


 LinkBack URL
 About LinkBacks


 Reply With Quote

1,300 Migrants swarm NYCs City Hall over false rumor of green...
04-25-2024, 07:27 AM in General Discussion