

Results 1 to 1 of 1
Thread Information
Users Browsing this Thread
There are currently 1 users browsing this thread. (0 members and 1 guests)
 LinkBack URL
 About LinkBacks
-
10-05-2022, 08:48 PM #1Senior Member


- Join Date
- Aug 2014
- Posts
- 9,167
Data: Foreign-Born Voting Population Rises in 75% of Swing States Since 2016
Data: Foreign-Born Voting Population Rises in 75% of Swing States Since 2016
by JOHN BINDER 5 Oct 2022
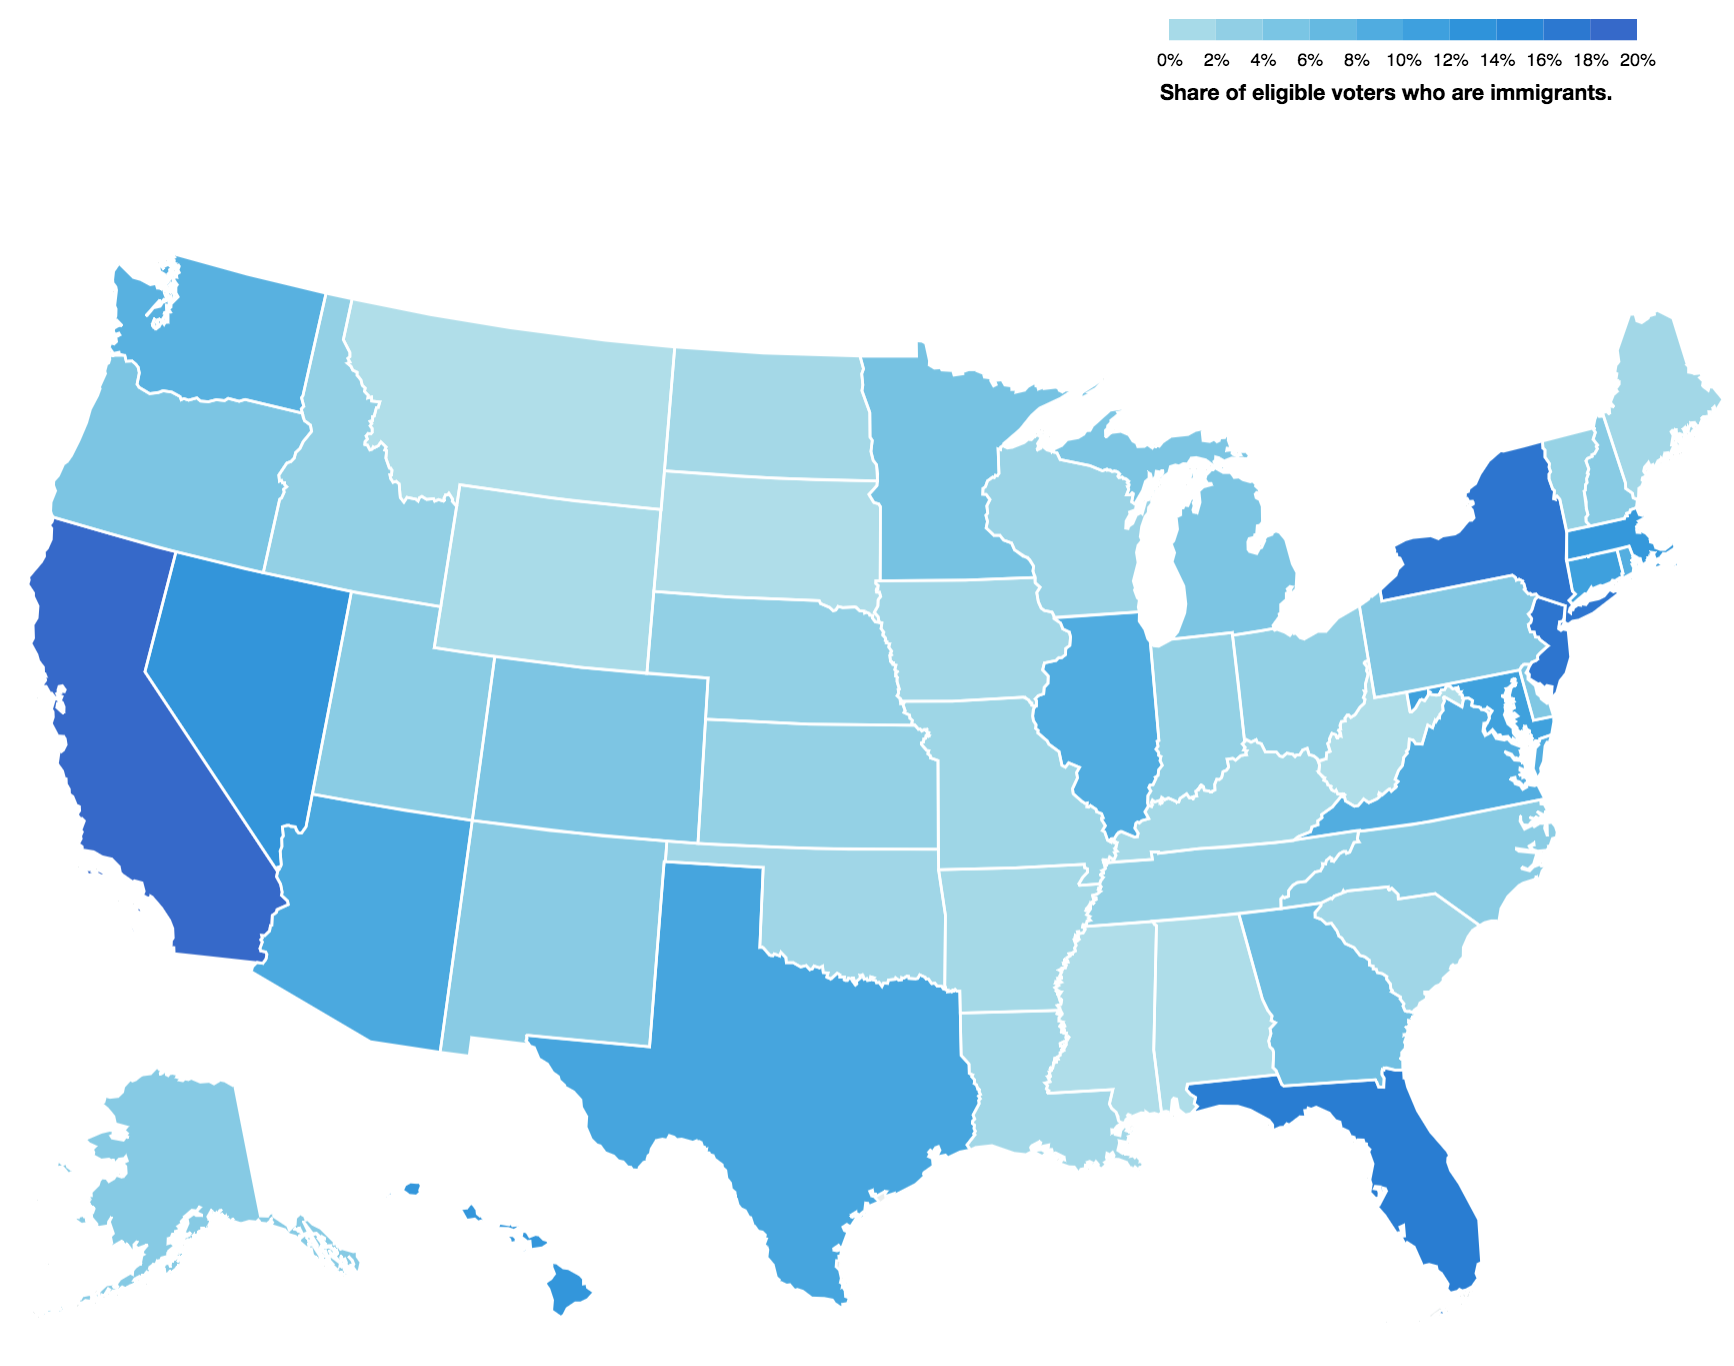
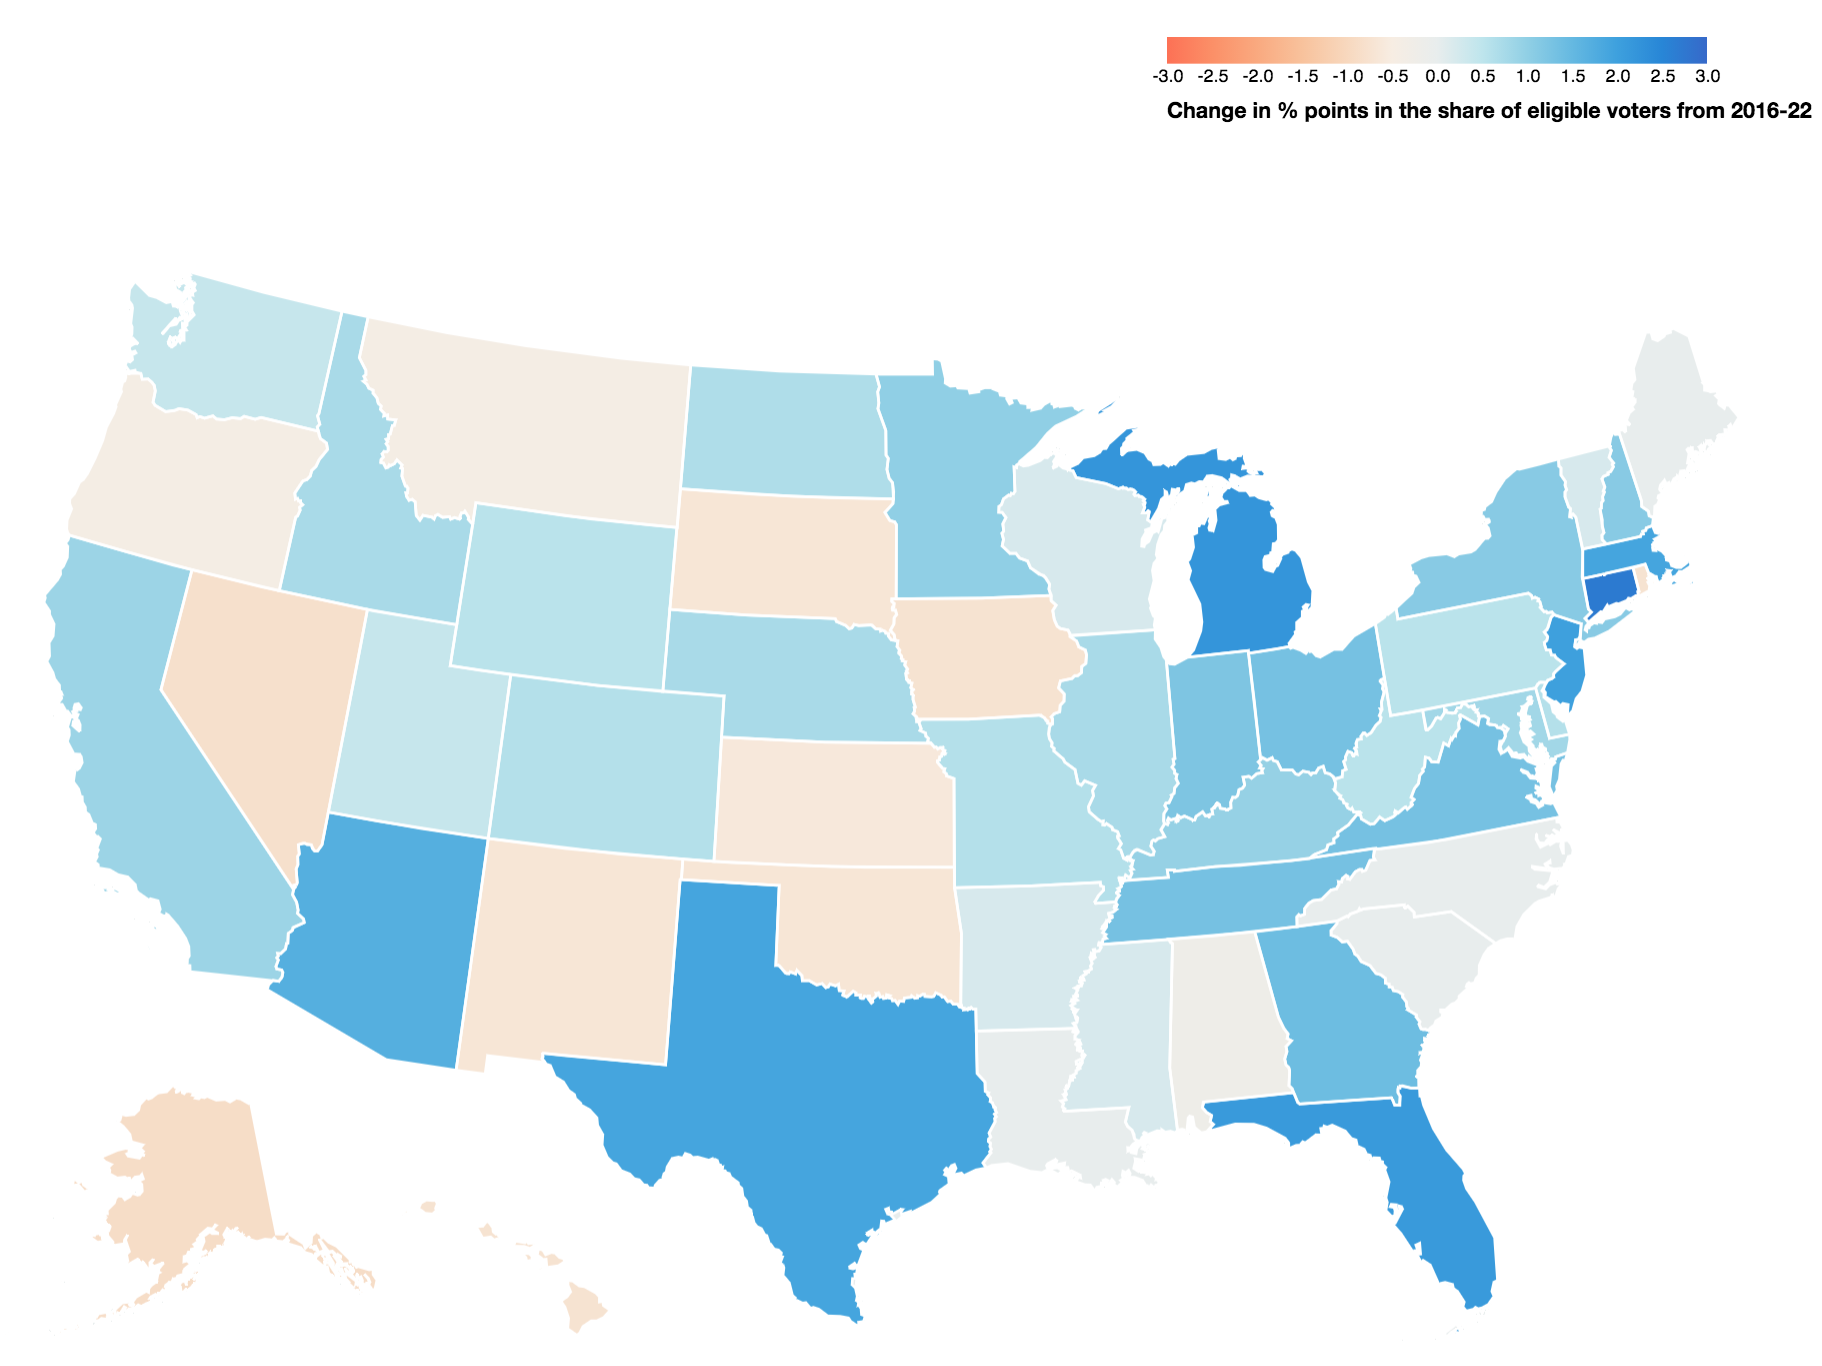
Mass immigration to the United States has pushed up the number of foreign-born voters across 75 percent of the nations critical swing states since 2016, new data shows.
The data, published by the American Immigration Council, reveals the extent to which ongoing mass immigration levels are dramatically changing the demographic makeup of the American electorate.
In nine of 12 swing states, for instance, the foreign-born voting population has risen over the last six years.
Most prominently, Florida, Michigan, Texas, and Arizona have seen the largest jumps in foreign-born voters over that time.
Foreign-born voters in Florida, for instance, now account for more than 17 percent of the states electorate. In Texas, more than 11 percent of the states electorate are foreign-born voters and in Arizona, the foreign-born voting population accounts for 10.5 percent of the electorate.
In swing states where close races are expected to take place, the extent to which changing electorates can be activated by each campaign may ultimately help determine who wins and loses come November, American Immigration Council researchers suggest of the impact on this years midterm elections.
Below is a breakdown of the foreign-born voter data by swing state:
Arizona
- Share of eligible foreign-born voters: 10.5 percent or about 535,000 voters
- Increase in share of eligible foreign-born voters from 2016 to 2022: +1.7 percent
- Margin of victory in 2016: 3.5 percent
- Margin of victory in 2020: 0.3 percent
Colorado
- Share of eligible foreign-born voters: 5.7 percent or about 239,000 voters
- Increase in share of eligible foreign-born voters from 2016 to 2022: +0.4 percent
- Margin of victory in 2016: 4.9 percent
- Margin of victory in 2020: 13.5 percent
Florida
- Share of eligible foreign-born voters: 17.1 percent or about 2,651,000 voters
- Increase in share of eligible foreign-born voters from 2016 to 2022: +2.1 percent
- Margin of victory in 2016: 1.2 percent
- Margin of victory in 2020: 3.4 percent
Georgia
- Share of eligible foreign-born voters: 6.8 percent or about 515,000 voters
- Increase in share of eligible foreign-born voters from 2016 to 2022: +1.4 percent
- Margin of victory in 2016: 5.1 percent
- Margin of victory in 2020: 0.2 percent
Iowa
- Share of eligible foreign-born voters: 2.4 percent or about 57,000 voters
- Decrease in share of eligible foreign-born voters from 2016 to 2022: -0.6 percent
- Margin of victory in 2016: 9.4 percent
- Margin of victory in 2020: 8.2 percent
Maine
- Share of eligible foreign-born voters: 2.4 percent or about 26,000 voters
- Increase in share of eligible foreign-born voters from 2016 to 2022: +0.0 percent
- Margin of victory in 2016: 3.0 percent
- Margin of victory in 2020: 9.1 percent
Michigan
- Share of eligible foreign-born voters: 5.8 percent or about 438,000 voters
- Increase in share of eligible foreign-born voters from 2016 to 2022: +2.2 percent
- Margin of victory in 2016: 0.2 percent
- Margin of victory in 2020: 2.8 percent
North Carolina
- Share of eligible foreign-born voters: 4.5 percent or about 342,000 voters
- Increase in share of eligible foreign-born voters from 2016 to 2022: +0.0 percent
- Margin of victory in 2016: 3.7 percent
- Margin of victory in 2020: 1.4 percent
Ohio
- Share of eligible foreign-born voters: 3.8 percent or about 330,000 voters
- Increase in share of eligible foreign-born voters from 2016 to 2022: +1.3 percent
- Margin of victory in 2016: 8.1 percent
- Margin of victory in 2020: 8.0 percent
Pennsylvania
- Share of eligible foreign-born voters: 5.1 percent or about 493,000 voters
- Increase in share of eligible foreign-born voters from 2016 to 2022: +0.3 percent
- Margin of victory in 2016: 0.7 percent
- Margin of victory in 2020: 1.2 percent
Texas
- Share of eligible foreign-born voters: 11.1 percent or about 2,096,000 voters
- Increase in share of eligible foreign-born voters from 2016 to 2022: +1.9 percent
- Margin of victory in 2016: 9.0 percent
- Margin of victory in 2020: 5.6 percent
Wisconsin
- Share of eligible foreign-born voters: 3.1 percent or about 135,000 voters
- Increase in share of eligible foreign-born voters from 2016 to 2022: +0.1 percent
- Margin of victory in 2016: 0.8 percent
- Margin of victory in 2020: 0.6 percent
 Screenshot via American Immigration Council
 Screenshot via American Immigration Council
President Joe Biden, last week, praised mass immigration and the resulting demographic changes as spurring so much opportunity to make this country so much better.
The data comes as Biden has spiked the number of foreign-born residents across a multitude of states and Democrats vow to add a million foreign-born voters to the nations voter rolls in the next four years.
Already, annually, the U.S. government rewards over a million foreign nationals with green cards and another more than a million with temporary work visas to take American jobs. In addition, under Biden, about 2.2 million illegal aliens have entered American communities.
Research and the establishment media have consistently admitted that the larger a regions foreign-born population, the more likely that region is to vote for Democrats over Republicans.
Democrat Hillary Clinton, in the 2016 presidential election, dominated with foreign-born voters against former President Trump. CNN exit polls show 64 percent of voters born outside the U.S. went for Clinton while just 31 percent voted for Trump.
Conversely, Trump won among native-born Americans.
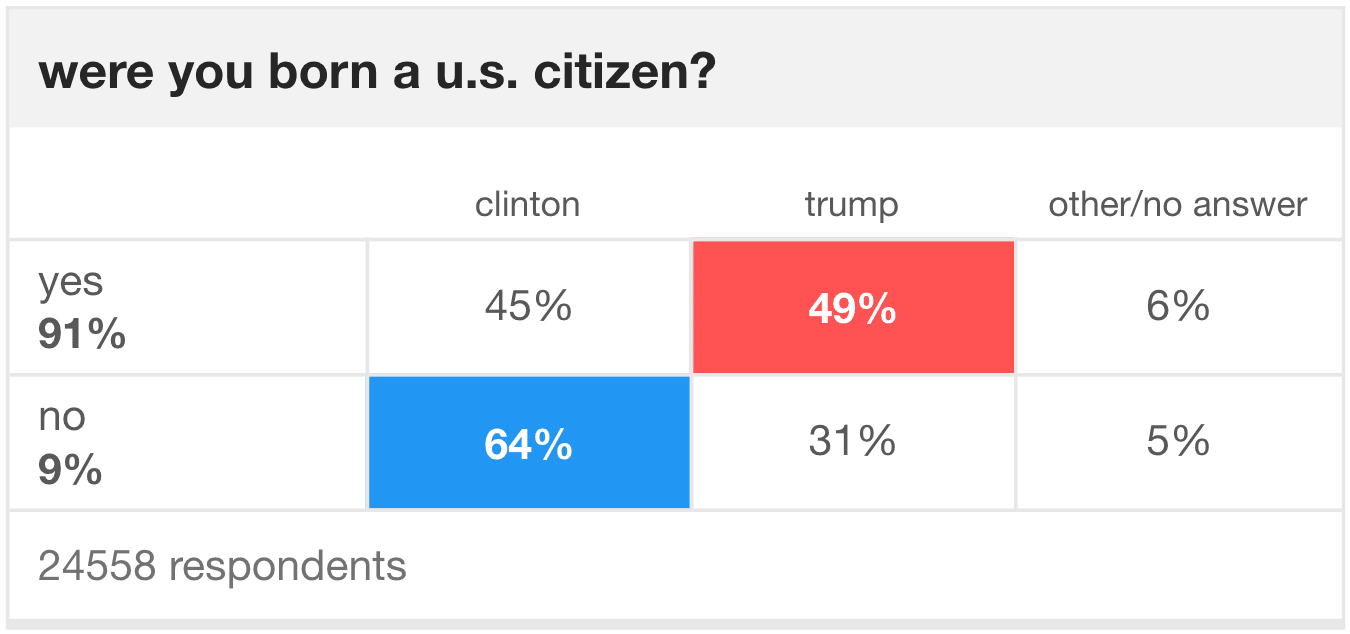 Screenshot via CNN
In 2019, The Atlantics Ronald Brownstein found that nearly 90 percent of House congressional districts with a foreign-born population above the national average are won by Democrats. This means every congressional district with a foreign-born population exceeding 15 percent has a 90 percent chance of electing Democrats and only a ten percent chance of electing a Republican.
The Washington Post, the New York Times, the Atlantic, Axios, the Los Angeles Times, and the Wall Street Journal have all admitted that rapid demographic changes spurred by mass immigration are tilting the nation toward a permanent Democrat political majority.
The single biggest threat to Republicans long-term viability is demographics, Axios acknowledged in 2019.
The numbers simply do not lie theres not a single demographic megatrend that favors Republicans.
Already, the U.S. has the most generous immigration system in the world expected to bring in 15 million new foreign-born voters by 2042. About eight million of those voters will have arrived entirely due to the process known as chain migration, whereby newly naturalized citizens can bring an unlimited number of foreign relatives to the U.S.
Foreign-Born Voting Population Rises in 75% Swing States Since 2016 (breitbart.com)Join our efforts to Secure America's Borders and End Illegal Immigration by Joining ALIPAC's E-Mail Alerts network (CLICK HERE)


 Reply With Quote
Similar Threads
-
Analysis: Biden Boosts Foreign-Born Population Across 2024 Swing States
By Scott-in-FL in forum General DiscussionReplies: 0Last Post: 06-03-2022, 10:36 PM -
Census Data: Biden Grows Foreign-Born Population by Nearly 2M in Last Year
By Scott-in-FL in forum General DiscussionReplies: 1Last Post: 11-25-2021, 08:35 AM -
Biden Swells Foreign-Born Voting Population Before Midterm Elections
By Scott-in-FL in forum General DiscussionReplies: 0Last Post: 11-11-2021, 12:07 AM -
As Caribbean immigration rises, Miamis black population becomes more foreign
By Newmexican in forum illegal immigration News Stories & ReportsReplies: 0Last Post: 04-11-2015, 08:28 AM -
Foreign-Born Population In The U.S. Concentrated In Four States, Study Finds
By JohnDoe2 in forum illegal immigration News Stories & ReportsReplies: 3Last Post: 05-24-2014, 09:08 PM


As Sen. Cortez Masto Scuttles Mayorkas' Impeachment, Illegal...
04-18-2024, 06:27 AM in Americans Killed By illegal immigrants / illegals