

Results 11 to 20 of 22
 25Likes
Thread Information
Users Browsing this Thread
There are currently 1 users browsing this thread. (0 members and 1 guests)
 LinkBack URL
 About LinkBacks
-
06-19-2018, 08:41 AM #11Super Moderator


- Join Date
- May 2005
- Location
- Heart of Dixie
- Posts
- 36,012
December 2017. The U.S. provides most of the funding for the IMF....Since 2010 the Governments of El Salvador, Guatemala and Honduras that been pumping as much of their uneducated poverty to the US. Those governments actively cultivate those illegal migrants to maintain their ties to their "home" countries to insure the remittance flows continue. Thus the addition of Consulates, immigatrion legal aid etc. Remember, all three of these countries sued the State of Arizona.
DECEMBER 7, 2017
Rise in U.S. Immigrants From El Salvador, Guatemala and Honduras Outpaces Growth From Elsewhere
Lawful and unauthorized immigrants increase since recession
BY DVERA COHN, JEFFREY S. PASSEL AND ANA GONZALEZ-BARRERA
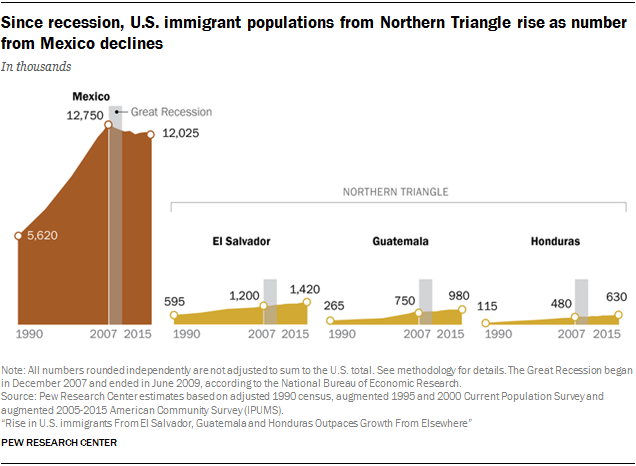
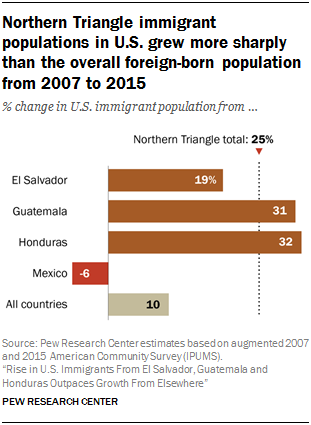
The number of immigrants in the United States from El Salvador, Guatemala and Honduras rose by 25% from 2007 to 2015, in contrast to more modest growth of the countrys overall foreign-born population and a decline from neighboring Mexico.
During these same years, the total U.S. immigrant population increased by 10%, while the number of U.S. Mexican immigrants decreased by 6%, according to a Pew Research Center analysis of U.S. Census Bureau data.
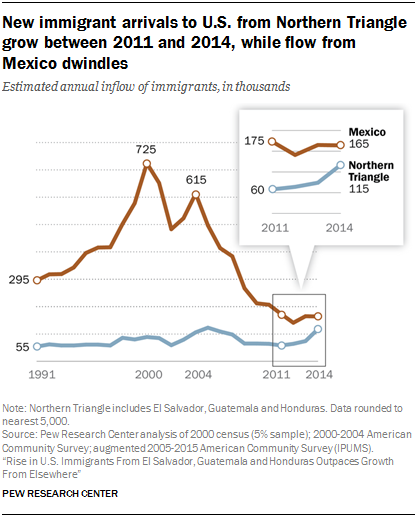
 One metric the number of new immigrants arriving in the U.S. each year illustrates dramatically how immigration trends from Mexico and the three Central American nations, known collectively as the Northern Triangle, have diverged in recent years. According to U.S. Census Bureau data analyzed by Pew Research Center, about 115,000 new immigrants arrived from the Northern Triangle in 2014, double the 60,000 who entered the U.S. three years earlier. Meanwhile, the number of new arrivals from Mexico declined slightly from 175,000 in 2011 to 165,000 in 2014.
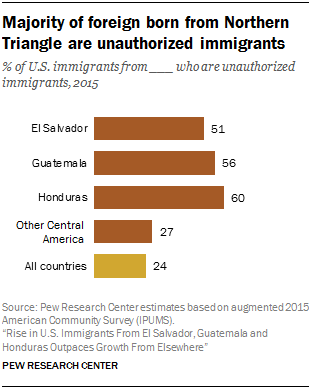
 Growing numbers of lawful as well as unauthorized immigrants from the Northern Triangle have made their way to the U.S. during the American economys slow recovery from the Great Recession (the recession began in December 2007 and officially ended in June 2009). Of the 3 million Northern Triangle immigrants living in the U.S. as of 2015, 55% were unauthorized, according to Pew Research Center estimates. By comparison, 24% of all U.S. immigrants were unauthorized immigrants.
Among the possible explanations for the recent rise in Northern Triangle immigration are high homicide rates, gang activity and other violence at home, according to a survey of migrants from the region. Other survey data indicate that Northern Triangle migrants are attracted to the U.S. for the same reasons as other migrants: economic opportunity and a chance to join relatives already in the country. The flow of money from the U.S. to the Northern Triangle is substantial: In 2015, Guatemala, El Salvador and Honduras were among the top 10 estimated remittance-receiving nations from the U.S., according to a Pew Research Center analysis.
More than a quarter million unauthorized immigrants from the Northern Triangle (roughly a fifth of unauthorized immigrants from the three countries) have temporary protection from deportation under two federal programs that the White House may phase out Deferred Action for Childhood Arrivals (DACA) and Temporary Protected Status (TPS). The three Central American nations are also the starting points for many of the thousands of unaccompanied children apprehended along the U.S.-Mexico border since 2013.
 The Northern Triangles recent rise in U.S. immigration diverges from the pattern for Mexico, the largest source of U.S. immigrants. The immigrant populations from both Mexico and the Northern Triangle had been increasing since the 1970s. But overall growth in the Mexican-born population in the United States declined or stalled since 2007, fed by a decline in unauthorized immigrants and a rise in the lawful immigrant population.
Heavily influenced by the decline from Mexico, the U.S. unauthorized immigrant population peaked in 2007 and fell over the next two years. It leveled off after 2009, because increases from the Northern Triangle and other regions balanced the continuing decline from Mexico. The U.S. lawful immigrant population overall grew over the decade, but not as sharply as it did from the Northern Triangle.
The 12 million Mexican immigrants living in the U.S. in 2015 far outnumbered those from the Northern Triangle, but the three Central American nations have grown in significance as a source of U.S. immigrants. In both 2007 and 2015, El Salvador ranked fifth among source countries, with 1.4 million immigrants in the U.S. in 2015. In those same years, Guatemala moved from 11th to 10th, with 980,000 U.S. immigrants in 2015. Honduras moved from 17th to 15th, with 630,000 immigrants in the U.S. in 2015.

Immigrants account for most of the 4.6 million U.S. residents with origins in El Salvador, Guatemala and Honduras and are the main driver of the groups growth. By contrast, two-thirds of Mexican Americans were born in the U.S., and births to U.S. residents are the main contributor to the groups population growth.
The recent surge in arrivals notwithstanding, most Northern Triangle immigrants have lived in the U.S. for at least a decade. Their households are more likely than those of immigrants overall to include minor children. And, as a group, their education levels and English proficiency are lower than those of U.S. immigrants overall.
Migrant motivations include economic opportunity
As for their reasons for moving, some limited survey data indicate that Northern Triangle migrants are attracted to the U.S. for the same reasons as other migrants: economic opportunity and reunification with family members. Other evidence, discussed below, suggests that some are being pushed out of their countries by widespread violence, which also was an important driver of Central American migration to the U.S. in the 1980s.
According to a 2011 Pew Research Center survey of U.S. Hispanic adults, Central American migrants 83% of whom were born in the Northern Triangle were less likely than other Latino migrants (46% vs. 58%) to cite economic opportunities as the main reason for relocating to the U.S. In addition, a smaller share of Central American immigrants cited family reasons for migrating (18% vs. 24% among other Hispanic immigrants).
Surveys of recently deported Northern Triangle migrants in their home countries 1 also found that work was a top motivator for their journey, according to a Pew Research Center analysis of 2016 data. Among Guatemalans deported from the U.S., 91% cited work as a main reason for coming, as did 96% of Hondurans deported from the U.S. and 97% of deported Salvadorans. Surveys of Northern Triangle migrants who were apprehended in Mexico while on the way to the U.S., then deported, also found that nearly all said they were moving to find work.
Violence may also play a role in immigrants motivations to migrate north
However, the same 2011 Pew Research Center survey that found economic opportunity was the top reason for Central American immigrants to come to the U.S. indicated that violence in Central America is a factor as well. Central Americans were more likely than other Latino migrants to cite conflict or persecution as a reason they left 13% said that was the main reason they came to the U.S., compared with 4% of other Hispanic migrants, according to the National Survey of Latinos.
A 2014 U.S. Department of Homeland Security document cited poverty and violence in Northern Triangle nations as forces that motivated unaccompanied children who were being apprehended at the border in large numbers. The document, which was obtained by Pew Research Center, cited rural poverty in Guatemala and extremely violent conditions in El Salvador and Honduras. At a conference on Northern Triangle issues this year, U.S. Vice President Mike Pence spoke of vicious gangs and vast criminal organizations that drive illegal immigration and carry illegal drugs northward on their journey to the United States.
At the time of the 2014 DHS report, Honduras had the worlds highest murder rate 74.6 homicides per 100,000 residents that year. El Salvador ranked second, with 64.2. Guatemala was ninth, at 31.2. In 2016, El Salvador had an even higher homicide rate than Honduras, 91.2 per 100,000 people. The Honduras rate was 59.1 and Guatemalas was 23.7.
Northern Triangle nations also are among the poorest in Latin America. In 2014, some had relatively high shares of people living on less than $2 a day 17% of Hondurans, 10% of Guatemalans and 3% of Salvadorans, according to World Bank data.
A 2013 Pew Research Center survey in El Salvador found that high shares of people living there 90% or more said crime, illegal drugs and gang violence were very big problems in their country. Half (51%) said they were afraid to walk alone at night within a kil0meter of their home.
The same survey also found that most Salvadorans not only knew someone already living in the U.S., but also wanted to move to the U.S. themselves. Nearly six-in-ten (58%) said they would move there if they could, including 28% who would move without authorization. Two-thirds of Salvadorans (67%) said they had friends or relatives who lived in the U.S. Most said people who move to the U.S. have a better life (64%) than those in their country.
Remittances and the Northern Triangle
The Pew Research Center survey of Salvadorans in 2013 found that 84% said it is good for El Salvador that many of its citizens live in the U.S.
One reason for that might be the money they send home: According to a Pew Research Center analysis of World Bank data, Guatemala, El Salvador and Honduras were among the top 10 estimated remittance-receiving nations from immigrants in the U.S. in 2015.
The money that immigrants send home to Northern Triangle nations has grown substantially in recent years, except for a one-year dip in 2009, the final year of the U.S. recession. In 2016, according to World Bank estimates, remittances to the three nations totaled $15.9 billion, of which most came from the U.S. Those remittances were the equivalent of about 17% of the total economic output (as measured by gross domestic product) in El Salvador, 11% in Guatemala and 18% in Honduras in 2016.
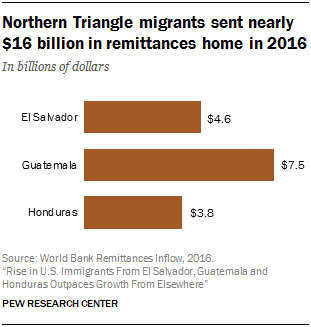
Guatemalan immigrants around the world sent home $7.5 billion in remittances in 2016, while Salvadorans sent $4.6 billion and Hondurans $3.9 billion, according to World Bank data. The vast majority of the money came from immigrants in the U.S.
The rise in remittances to Northern Triangle nations diverged from a decline in overall remittances to developing nations in 2016. A World Bank brief about global remittance trends, published in October, noted that money sent home by Northern Triangle and Mexican migrants went up despite an increase in deportations from the U.S. The increase in remittances is in part due to possible changes in migration policies. Migrants are sending their savings back home in case they must return.
The World Bank brief also stated that remittances may continue to rise because the tighter U.S. labor market could be driving employment, especially in the construction industry. Immigrants are overrepresented in the U.S. construction industry: They were 17% of the total workforce in 2014, but 24% of the construction workforce.
As these immigrant populations have gone up, Northern Triangle governments have expanded their outreach to their nationals in the U.S. The Guatemalan government, for example, opened two new consulates this year, in Raleigh, North Carolina, and in Oklahoma City. El Salvador opened a consulate in McAllen, Texas, in 2014 and another one in Aurora, Colorado, earlier this year.
This report is based largely on Pew Research Center analysis of U.S. Census Bureau data. Figures have been adjusted for undercount, so findings differ from official published numbers, but the trends and patterns are similar for both.
1. Recent trends in Northern Triangle immigration
BY DVERA COHN, JEFFREY S. PASSEL AND ANA GONZALEZ-BARRERA
Migration from Central America to the U.S. began rising notably in the 1980s, and continued to increase in subsequent decades. More recently, the number of immigrants lawful and unauthorized from the three Northern Triangle nations rose by 25% between 2007 and 2015. During that same period, the immigrant population from Mexico, the largest birth country for U.S. immigrants, declined 6%. The overall U.S. immigrant population rose 10% during the same period. Altogether, the 3 million immigrants from the Northern Triangle were 7% of the U.S. foreign-born population of 44.7 million in 2015.
This Northern Triangle growth included increases in the number of both lawful and unauthorized immigrants. From 2007 to 2015, the lawful immigrant population from El Salvador, Guatemala and Honduras grew 24% and the unauthorized immigrant population grew 26%. By comparison, the national lawful immigrant population increased by 19% from 2007 to 2015, and the unauthorized immigrant population declined by 10%.
Immigration from the Northern Triangle has helped to expand the origin populations from these three countries. Including both immigrants and the U.S. born, the number of U.S. Hispanic residents with origins in the three Northern Triangle countries rose even more sharply (46%) from 2007 to 2015. This total includes 1.2 million U.S.-born children with family origins in these three countries.
Although the U.S.-born components of these populations are growing rapidly, at least six-in-ten U.S. residents of Salvadoran, Guatemalan or Honduran origin were immigrants in 2015, compared with 53% of those with other Central American origins (Belize, Costa Rica, Nicaragua and Panama). A third of Mexican Americans (33%) are foreign born. By comparison, 14% of all U.S. residents were foreign born in 2015.
A majority of Northern Triangle immigrants are unauthorized immigrants
Among all U.S. immigrants, one-in-four (24%) were unauthorized immigrants in 2015, according to Pew Research Center estimates. Among those from the Northern Triangle nations, a majority were unauthorized immigrants 51% from El Salvador, 56% from Guatemala and 60% from Honduras. The share of unauthorized immigrants from other Central American nations (27% in 2015) was closer to the overall U.S. share.
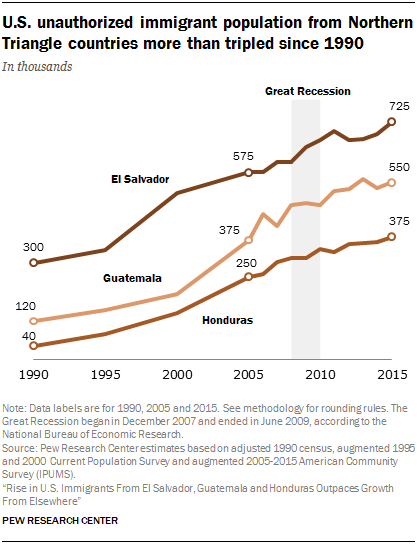
The number of U.S. unauthorized immigrants from Northern Triangle nations has risen since the 2007-2009 Great Recession, and the three Northern Triangle nations rank among the top countries for the size of their unauthorized immigrant populations. In 2015, there were about 725,000 unauthorized immigrants from El Salvador, 550,000 from Guatemala and 375,000 from Honduras. By contrast, the total number of U.S. unauthorized immigrants, 11 million in 2015, is 10% less than in 2007 and has ticked down since 2009. The number from Mexico, the largest birth country for unauthorized immigrants, has declined notably from 6.4 million in 2009, to 5.6 million in 2015.
Temporary Protected Status and DACA
Several hundred thousand unauthorized immigrants from the Northern Triangle have received temporary permission to live and work in the U.S. under two federal programs with uncertain futures.
About 195,000 Salvadorans and 57,000 Hondurans are estimated to be protected from deportation under Temporary Protected Status (TPS), a program that allows relief based on natural disasters or other catastrophes in their home countries. In order to qualify, they must meet residency and criminal-record requirements. The U.S. governments current designation of immigrants from El Salvador as eligible for Temporary Protected Status began in 2001, based on a series of earthquakes in that country that inflicted widespread damage and killed more than a thousand people. For Honduras, TPS eligibility began in 1999 based on Hurricane Mitch in 1998, which killed more than 5,600 people and displaced more than a million.
The Temporary Protected Status permits are set to expire July 5 for people from Honduras, and March 9 for people from El Salvador. The presidents of both countries have asked the U.S. government to extend the temporary program. The administration is required to state 60 days in advance whether it intends to extend or terminate the protected status, and protection automatically extends for six months if such a notice is not published. In advance of the governments decision, Secretary of State Rex Tillerson reportedly submitted a required assessment in which he said that home-country conditions no longer necessitate protected status for immigrants from Central America.
Although some TPS recipients may be in the U.S. on valid temporary visas, Pew Research Center assumes that nearly all immigrants with TPS are in the country without authorization.
Nearly 60,000 young unauthorized immigrants from the three countries have received work permits and relief from deportation under the federal Deferred Action for Childhood Arrivals program, according to the most recent Department of Homeland Security statistics, released Sept. 4. They include about 25,900 from El Salvador, 17,700 from Guatemala and 16,100 from Honduras. (There may be some recipients of DACA status who also have Temporary Protected Status.)
The program, created by President Barack Obama with an executive action signed in August 2012, provides a two-year renewable work permit and protection from deportation to unauthorized immigrants who came to the U.S. before age 16 and meet certain other conditions. President Donald Trump has ordered that the program be phased out, unless Congress passes legislation to extend it past March 5, 2018.
Apprehensions and deportations

In addition to the rise in the number of Northern Triangle immigrants living in the U.S., government statistics also show a recent increase in migrants from the three nations apprehended at the border. In fact, according to U.S. Customs and Border Protection statistics, apprehensions of Northern Triangle immigrants outnumbered those of Mexicans at the U.S. Southwest border in fiscal 2014, 2016 and 2017. The law enforcement agency says fiscal 2014 was the first time that apprehensions of Central Americans outnumbered those from Mexico. About 99% of Central American apprehensions that year were of immigrants from the Northern Triangle.
Mexicans continue to be the majority of those deported by U.S. border authorities, but the three Northern Triangle nations ranked second, third and fourth for deportations in fiscal 2016. In fiscal 2016, about 34,000 Guatemalans, 22,000 Hondurans and 20,000 Salvadorans were removed. Together they accounted for about a fifth (22%) of deportations by U.S. Department of Homeland Security officials. About 245,000 Mexicans were deported, or 72% of removals.
People turned back at the border or held in immigrant detention centers are not included in U.S. Census Bureau immigrant statistics. However, the census data analyzed in this report could include migrants who are detained and then released in the U.S. while their cases are adjudicated, though it is not possible to differentiate them from other migrants in the data.
Beginning in fiscal 2013, a rising number of unaccompanied children were apprehended at the U.S. border with Mexico, according to U.S. Customs and Border Protection data from the Department of Homeland Security. The number from the Northern Triangle peaked at 51,705 in fiscal 2014. In the 2017 fiscal year, there were 31,754 apprehensions of children from El Salvador, Guatemala and Honduras.
Migrants from El Salvador, Guatemala and Honduras also drove a surge in apprehensions of family groups children and their parents or guardians in 2016. According to Customs and Border Protection data, there were 71,145 family apprehensions of Northern Triangle migrants in fiscal 2017, compared with 2016s total of 70,407.
El Salvador among the top countries for green cards to lawful immigrants
Some Northern Triangle nations rank among the top birth countries for new U.S. lawful permanent residents, according to U.S. Department of Homeland Security statistics. In 2015, El Salvador ranked ninth among countries for the number of green cards issued to people born there, and has ranked in the top 14 since 2006. Guatemala ranked 22nd in 2015, and has been in the top 28 since 2006. Honduras ranked 28th in 2015 and has been in the top 40 since 2006.

More than 37,000 immigrants from the three Northern Triangle nations were granted green cards, giving them lawful permanent resident status, in the first three quarters of the 2017 fiscal year (Oct. 1, 2016, through June 30). A total of 18,805 green cards were granted to immigrants from El Salvador, most of them (11,620) new arrivals rather than people already in the U.S. adjusting their immigration status. A total of 9,935 green cards went to Guatemalans, about half of whom (5,003) were new arrivals. For Hondurans, 8,427 green cards were granted, but less than half (3,853) went to new arrivals.
Among all 845,951 immigrants who obtained lawful permanent residence in the first three quarters of fiscal 2017, about half were new arrivals and half were people already living in the U.S. who adjusted their status.
Most Northern Triangle immigrants are admitted because they have relatives already living in the U.S., as is true of immigrants overall.
Only a small number of lawful immigrants from Northern Triangle nations arrive as refugees 974 from El Salvador, 50 from Guatemala and 93 from Honduras from Oct. 1, 2016, to June 30, according to Department of Homeland Security statistics. A total of 49,232 refugees arrived during that time.
Asylum applications from Northern Triangle nations rise since 2013
Asylum applications from people born in El Salvador, Guatemala and Honduras have risen sharply in recent years, according to U.S. government data. There were more applications in fiscal 2013-2015 from the three nations than in the previous 15 years combined, according to data from the U.S. Department of Homeland Security.
The three Central American nations accounted for 37% of all asylum applications filed with two U.S. government agencies in fiscal 2015 and 2016. That amounted to 112,151 applications. In fiscal 2014, 24% of asylum seekers came from the three Northern Triangle nations.
Partial data for fiscal 2017 also show that 37% of applicants 79,571 of 215,213 came from the Northern Triangle. Numbers are available for the full fiscal year (October 2016-September 2017) from the Department of Homeland Securitys Citizenship and Immigration Services, which handles affirmative applications from those in the U.S. Numbers are available through May 2017 from the Justice Departments Executive Office for Immigration Review, which handles defensive applications from those in removal proceedings.
2. Geography and characteristics of Northern Triangle immigrants
BY DVERA COHN, JEFFREY S. PASSEL AND ANA GONZALEZ-BARRERA
Worldwide, more than eight-in-ten migrants born in El Salvador, Guatemala and Honduras live in the United States, according to United Nations estimates. That included 89% of Salvadoran migrants, 86% of Guatemalans and 82% of Hondurans in 2015.
Among all those born in El Salvador worldwide those who live in El Salvador and those who live elsewhere 23% reside in the U.S., according to United Nations figures for 2015. For Guatemalans and Hondurans, the shares in the U.S. are smaller 6% and 8%, respectively but still consequential.

Most Northern Triangle immigrants live in states that also are popular with other immigrants, especially those from Latin America. In all, 84% of Salvadoran immigrants lived in the 10 most popular states for immigrants from their country in 2015, as did 72% of Guatemalan and 79% of Honduran immigrants. Nearly three-quarters (74%) of immigrants overall lived in the most popular states for the foreign-born population.
More than any other state, California has the largest share of Salvadoran immigrants (30% lived there in 2015) and Guatemalan immigrants (29%). Its also the top state for U.S. immigrants overall one-in-four live there. For Hondurans, though, Texas (17% in 2015) and Florida (15%) are at least as popular as California (11%). Texas has the second largest population of U.S. immigrants; 11% lived there in 2015.
However, several states that are not among the top 10 destinations for immigrants are popular with those from Northern Triangle countries. They include Maryland for immigrants from all three countries, North Carolina for Guatemalans and Hondurans, Nevada for Salvadorans and Louisiana for Hondurans.
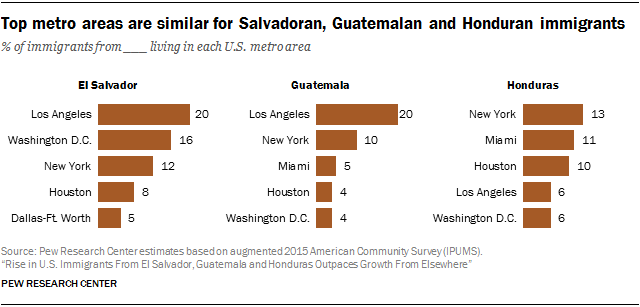
Immigrants from the three countries also are most likely to live in metro areas that are popular destinations for other immigrants, according to 2015 census data.
The top five for each group include Los Angeles, New York, Washington, D.C., and Houston, as well as Dallas (for Salvadorans) and Miami (for Guatemalans and Hondurans). A higher share of Salvadorans live in their top 20 metro areas (81%) compared with Guatemalans (67%) and Hondurans (70%). Among all immigrants, 65% live in the top 20 metros.
Among the nations 50 largest metropolitan areas, a Northern Triangle nation is the largest birth country in only two. Salvadorans are the largest immigrant group in the Washington, D.C., metropolitan area, and Hondurans are the largest in New Orleans, according to 2015 Census Bureau data.
Most Northern Triangle immigrants have lived in the U.S. a decade or more
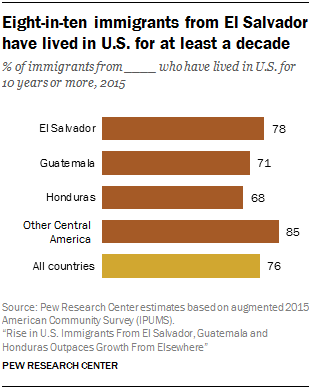
Despite the large number of immigrants who arrived in the past decade, most immigrants from El Salvador, Guatemala and Honduras have lived in the U.S. for 10 years or more, as is true for the majority of all U.S. immigrants.
Among immigrants in 2015, 78% from El Salvador, 71% from Guatemala and 68% from Honduras had lived in the U.S. for 10 years or more. Immigrants from other Central American nations are even more likely to be longer-term U.S. residents: 85% have lived in the U.S. for at least a decade as of 2015. Among all U.S. immigrants in 2015, 76% lived in the U.S. for 10 years or more. The share of immigrants in the U.S. for 10 years or more has risen for all these groups since 2007.
Most unauthorized immigrants also have lived in the U.S. for at least 10 years. The share residing in the U.S. a decade or more has risen since 2007 for all unauthorized immigrants, for Northern Triangle unauthorized immigrants and for other Central American unauthorized immigrants. For unauthorized immigrants overall, as well as for those from Guatemala and Honduras, the share in the U.S. for 10 years or more has been a majority since 2007.
For comparison purposes, immigrants from Mexico are at least as likely as those from Northern Triangle nations to have lived in the U.S. for a decade or more. Among all Mexican immigrants in 2015, 85% had; among unauthorized immigrants from Mexico, 80% had.
U.S. immigrants from El Salvador, Guatemala and Honduras are especially likely to be of working age 18 to 64. Among all immigrants, 80% were in this age group in 2015, but that share is nearly nine-in-ten among Salvadorans (88%), Guatemalans (86%) and Hondurans (87%). By contrast, among all people born in the U.S., 60% were of this age in 2015.
Guatemala is the only Northern Triangle country from which there are substantially more men (59% in 2015) than women (41%) among U.S. immigrants. The shares are nearly equal for Salvadorans and Hondurans, as they are for U.S. immigrants overall. However, there is gender imbalance in the other direction among other Central American immigrants; this group is 56% female. Among all U.S. immigrants, 50% are female.
The labor force status of Northern Triangle immigrants varies by gender. Men from the Northern Triangle are more likely to be working or looking for work than immigrants overall or people born in the U.S. Among those ages 18 to 64, 91% of Northern Triangle male immigrants were in the labor force in 2015, compared with 86% of all male immigrants and 79% of U.S.-born men.
Among women ages 18 to 64, labor force participation varies by birth country, but it is lower than for all U.S.-born women. Linked to their lower labor force participation is their greater likelihood to have young children at home. Northern Triangle immigrants are at least twice as likely as U.S.-born women to have young children at home.
Most Northern Triangle immigrant homes include children

Households headed by immigrants from Northern Triangle nations are more likely to include children younger than 18 than immigrant households overall in the U.S. While 45% of immigrant households included minor children in 2015, the share was 60% for those headed by a Salvadoran immigrant, 57% for those headed by a Guatemalan immigrant and 60% for those headed by a Honduran immigrant. Among households headed by other Central American immigrants, 40% included minor children. (By contrast, only 29% of households headed by a U.S.-born adult included children in 2015.)
The share of households with children is higher for homes headed by unauthorized immigrants than by lawful ones. Among all Northern Triangle unauthorized immigrant households, 63% had minor children in 2015, compared with 55% for households headed by a lawful Northern Triangle immigrant.
A single-person household someone living alone is relatively uncommon for Central American immigrants, especially those from the Northern Triangle. Among Salvadoran immigrants, 9% lived alone in 2015, compared with 12% for Guatemalan immigrants and 14% for Honduran immigrants. Among all immigrants, 19% did. Among all the U.S. born, 30% did.
According to other census data for individuals (not households), about four-in-ten immigrant adults from the three Northern Triangle nations live with minor children. The vast majority of those immigrant adults about nine-in-ten live with U.S.-born children, who are U.S. citizens at birth.
Education levels relatively low for Northern Triangle immigrants

The educational attainment of the immigrant population from Northern Triangle nations is below that of all U.S. immigrants. Among those ages 25 and older, half or more from each country have not completed high school, compared with 29% of all immigrants, according to 2015 U.S. Census Bureau data. Most of those who have not finished high school have less than a ninth grade education; fully 39% of Northern Triangle immigrants had this level of schooling in 2015.
Among Northern Triangle immigrants in 2015, 27% had a high school diploma or GED equivalent and no further education, 11% had some college education or a two-year degree and 7% had a bachelors degree or more. The comparable shares for the foreign-born population overall in 2015 were 26%, 15% and 30%.
In looking at educational attainment, legal status matters: Most Northern Triangle unauthorized immigrants have not completed high school (60%), compared with 48% of lawful immigrants from the region.
Educational attainment is notably higher among U.S.-born residents with roots in the three Central American nations. In that group, the vast majority has a college degree (24% in 2015), some college (30%) or a high school education (30%). Only 16% did not complete high school.
Most Northern Triangle immigrants are not proficient in English
Immigrants from El Salvador, Guatemala and Honduras are less likely than other foreign-born residents of the U.S. to be proficient in English. English proficiency is defined as either speaking only English at home or, if someone speaks another language at home, that person speaks English very well.
In 2015, half of U.S. immigrants ages 5 and older (51%) were proficient in English, compared with almost a third of those from the Northern Triangle.

Most households of immigrants from Central America speak a language other than English at home. Among immigrants ages 5 and older, only 4% from El Salvador, 7% from Guatemala and 4% from Honduras spoke English and no other language at home in 2015. Nearly all who do not speak only English at home said they spoke Spanish. By comparison, among all immigrants, 16% spoke only English at home, according to 2015 census data.
English proficiency tends to be higher for immigrants with college degrees and lawful status. As with education levels, immigration status is relevant: Unauthorized immigrants from each of the three countries are less likely to be proficient than lawful immigrants. The relatively high share of Northern Triangle immigrants who do not have high school diplomas or lawful status helps explain their relatively low levels of English proficiency.
http://www.pewhispanic.org/2017/12/07/rise-in-u-s-immigrants-from-el-salvador-guatemala-and-honduras-outpaces-growth-from-elsewhere/Support our FIGHT AGAINST illegal immigration & Amnesty by joining our E-mail Alerts at https://eepurl.com/cktGTn
-
06-19-2018, 09:00 AM #12Super Moderator
- Join Date
- May 2005
- Location
- Heart of Dixie
- Posts
- 36,012
December 18, 2013
El Salvador earns 14 times as much in remittances from emigrant workers as from aid.
By Edward Gresser
THE NUMBERS: Financial flows to low- and middle-income countries*
Remittances from expatriate workers:* $354 billion
Foreign aid programs, 2012:** $161 billion
* Excluding remittances to wealthy countries and China.
** OECD. Total combines aid programs run by the 31 OECD member countries, the World Bank and regional development banks, three Gulf monarchies (Saudi Arabia, Kuwait, and the UAE), Russia, and Thailand, but not China, India, or Taiwan. Figures are gross as opposed to net aid flows.
WHAT THEY MEAN:
Who changes the world? Governments developing policy? Scientists and engineers as they research and invent? Businesses investing and producing things, intellectuals with ideas, charities and NGOs acting on humanitarian imperative? No doubt all play their part. But dont discount a populist fifth force: expatriate dishwashers, farm-laborers, construction workers, nurses, maids, and other workers, taking a bit from their modest incomes to help friends and family.
Heres a seasonal anecdote: Washingtons largest immigrant community, the 200,000 Salvadoran-Americans living in D.C., suburban Maryland and northern Virginia, is by and large a working-class group. Salvadoran-American median earnings (nationwide) are about $20,000 per person, with top employment areas construction, maintenance, and unspecified services. Nonetheless, Salvadorans on average manage to send $2,950 per year back home, with the biggest sums coming in the holiday season. This means perhaps $100 million will flow this month (and $600 million over the year) from storefronts and banks in D.C.s Adams Morgan neighborhood, Wheaton in Maryland, and other community centers to San Salvador, Chalatenango, and Usulutan. In total, families in El Salvador received $4.2 billion in remittance money over 2013, which is a sixth of the countrys GDP, and 14 times its $290 million in aid flows.
Worldwide, the picture of financial flows to lower-income countries (not including exports, which outdo the rest, and accepting uncertainty despite the best efforts of P.E.s research staff for charitable donations; more detailed figures on each with some more explanation are below):
* OECD estimate of aid provided by NGOs.Remittances $354 billion Foreign Direct Investment $290 billion Development & Other Aid $161 billion Private charities & NGOs $32 billion??*
The four types of financial flows, of course, have different uses and motivations, and arent really directly comparable. Official aid and charitable donations aim to improve governance, provide emergency help after disasters, and support public services like schools and vaccination systems. FDI is a private-sector flow designed for profit, employment, and growth; remittances are direct financial support to families and neighbors. And developing country export flows, at $3.3 billion even subtracting Chinese exports and oil revenues, outdo them all. But accepting these cautions and distinctions and cautions, it remains the case that the worlds ordinary working people do at least as much as the wealthy, the famous, and the powerful to ease poverty, provide balance to growth, and change things a bit for the better.
FURTHER READING:
Remittances worldwide
The World Banks most recent estimate (in October 2013) estimated a global $550 billion remittance total. This includes $140 billion sent home to wealthy countries (e.g. from American petroleum engineers working in the Gulf states, securities traders in London, etc.) and $60 billion sent to China. Subtracting these, we get the $354 billion for lower-income countries. India was the top recipient at $71 billion, followed by the Philippines at $26 billion, Mexico at $23 billion, and then Nigeria, Egypt, Pakistan, Bangladesh, and Ukraine. Relative to national economies, smaller countries rely most on remittances, with land-locked countries and small island states, with Central Asia, Nepal, Lesotho, Swaziland, and other low-income landlocked countries joining island states like Haiti and Samoa at the top. The World Bank on global remittance trends in 2013:http://www.worldbank.org/en/news/pre...013-world-bank
And a closer look at cost, efficiency, and profit Remittances cost some money, and typically fees for small wires sent by low-income workers remain noticeably higher than money-management fees levied on wealthy financial-services clients. The most efficient remittance services for workers are in Singapore: by the World Banks estimate, a Thai worker in Singapore helping family pay for the Phi Mai (New Years) party next week will lose only $2.75 of her $200 wire to fees. The most expensive are intra-African wires a Malawi miner sending $200 home will lose $47 to banking and wire fees.) The U.S., source of $125 billion in remittances or a quarter of the global total, is toward the efficient end of the scale, with an average cost of 6.4 percent. The Banks remittance-cost database: http://remittanceprices.worldbank.org/
Salvadoran case study
The people The Pew Center examines the Salvadoran-American community in statistics: http://www.pewhispanic.org/2013/06/19/hispanics-of-salvadoran-origin-in-the-united-states-2011/
The money Also from Pew, figures on remittance flows from the U.S. to Latin America: http://www.pewhispanic.org/2013/11/15/remittances-to-latin-america-recover-but-not-to-mexico/ph-remittances-11-2013-a-08/
The cost Rating remittance-senders by cost, the Inter-American Development Banks Envia CentroAmerica database finds 12 DC-area firms sending to El Salvador, with costs typically around 4% and 5%. The lowest-cost option is a 2.5% fee for a $200 wire from a bank account to a cash receipt, delivered within 3-5 days. The highest-cost option costs the $200 sender $33 a 16.5% fee for a one-hour emergency debit-card-to-cash transaction. The average rate, around 5 percent, has dropped from 12.5 percent fee a decade ago; by comparison, hedge-fund managers are said to average 2% fees for their wealthy clients. Envia CentroAmerica, with figures for remittance from eight American cities: http://www.enviacentroamerica.org/
And Wheatons 2013 Salvadoran Festival (last August) advertises health screenings, passport renewals, and other public services:http://www6.montgomerycountymd.gov/a...asp?PrID=10154
The Embassy of El Salvador: http://www.elsalvador.org/
Comparisons
Aid Tallying worldwide development-aid programs, the OECD finds its 31 members offering $126 billion in development, economic, and other aid programs in 2012. Slightly more than half came from European countries, led by the UKs $13.7 billion, Germanys $13.1 billion, and Frances $12.1 billion. The U.S. remained the largest single donor country at $27 billion, and Japan at $10.5 billion. Adding multilateral agencies, and a few other countries (Saudi Arabia, Russia, Kuwait, the United Arab Emirates, and Thailand, but not China, Taiwan, or India) OECD statisticians get a full figure of $161 billion in aid flows as of
2011:http://www.oecd.org/department/0,335..._1_1_1,00.html
Investment Figures on foreign direct investment in lower-income countries come from the UN Conference on Trade and Developments World Investment Report 2013. Removing the Gulf monarchies, Russia, China, Hong Kong, Taiwan, Korea, and Singapore from UNCTADs somewhat dated definition of developing country, this places FDI in developing countries at $290 billion for 2012, with the largest recipients Brazil at $65 billion, Chile at $30 billion, and Indonesia at $20 billion. By way of comparison, the U.S. was at $167 billion, China $121 billion, and the UK $62 billion. UNCTADs WIR: http://unctad.org/en/pages/Publicati...licationid=588
And charity Charitable-donation counts are scarce. The World Banks 2011 World Development Indicators estimated $22 billion, with Americans accounting for a startlingly high $16 billion, or 75% of the total. The Bank hasnt published an estimate in the two succeeding years, though, and perhaps the total was unreliable. The OECDs database finds $32 billion in aid given by NGOs in 2011.
In lieu of an authoritative figure, we link instead to the World Giving Index, an entertaining set of national rankings published by the U.K.-based Charities Aid Foundation. Like the World Bank in its reports up to 2010, this survey finds Americans particularly generous givers. Ranking countries on a combination of frequency of individual donations, hours spent volunteering, and willingness to offer assistance to strangers, it places Americans first among 135 studied countries in 2012, with Myanmar, Canada, and New Zealand tied for second. Majority-Buddhist countries seem to fare especially well: Thailand ranks first in volunteerism, and Myanmar first for frequency of charitable donation. Not such a happy picture for China and Russia, though. Note again that the rankings depend on (a) use of formulae, and (b) polling reports, whose accuracy may differ by country, rather than official data, so they are perhaps a bit subjective. CAFs 2013 report:https://www.cafonline.org/publications/2013-publications/world-giving-index-2013.aspx
Special Note ProgressiveEconomys Trade Fact service will take a break next week for the holidays. Conscious of our blessings and mindful of those who have less, we offer our grateful thanks to members and contributors and wish all our readers and friends a joyful holiday season.
http://www.progressive-economy.org/t...s-as-from-aid/Support our FIGHT AGAINST illegal immigration & Amnesty by joining our E-mail Alerts at https://eepurl.com/cktGTn
-
06-19-2018, 01:21 PM #13Senior Member

- Join Date
- Aug 2005
- Posts
- 55,883
I hate these countries. I'll never buy a watermelon or any other item from Guatemala again.
A Nation Without Borders Is Not A Nation - Ronald Reagan
Save America, Deport Congress! - Judy
Support our FIGHT AGAINST illegal immigration & Amnesty by joining our E-mail Alerts at https://eepurl.com/cktGTn
-
06-19-2018, 02:51 PM #14Super Moderator
- Join Date
- May 2005
- Location
- Heart of Dixie
- Posts
- 36,012
I never have. If it is from Mexico or Guatemala, I leave at the store.. Originally Posted by Judy
 Support our FIGHT AGAINST illegal immigration & Amnesty by joining our E-mail Alerts at https://eepurl.com/cktGTn
-
06-19-2018, 02:54 PM #15Moderator

- Join Date
- Apr 2016
- Posts
- 31,048
They have been ripping us off for decades.
President Trump...No DACA deal...deport them all.
Charter buses on the border and return them to their countries.ILLEGAL ALIENS HAVE "BROKEN" OUR IMMIGRATION SYSTEM
DO NOT REWARD THEM - DEPORT THEM ALL
-
06-19-2018, 03:02 PM #16Super Moderator
- Join Date
- May 2005
- Location
- Heart of Dixie
- Posts
- 36,012
This explains BRIDGE a bit more.
remarks
Jose W. Fernandez
Assistant Secretary, Bureau of Economic, Energy and Business Affairs
Remarks at AACCLA Luncheon
Miami, Florida
February 3, 2011
As Prepared for Delivery
Good afternoon its a pleasure to be able to join such a diverse audience - whose interest in the U.S. - Latin America relationship span the business, policy, academic, and personal spectrums. I want to thank the Chamber for the opportunity to speak today.
Its been a unique honor to serve the President Obama and Secretary Clinton as the Assistant Secretary of State for Economic Affairs, particularly in a time of such global economic change. Before I came to the State Department, I spent quite a bit of time in Latin America, primarily negotiating financings with governments, private companies, state owned businesses and everything in between. This gave me firsthand insight into the social and economic challenges in the region. And since Ive taken office, that experience has served me well as I continue to work on these issues in government as part of our broader agenda in the region.
And with an outlook framed by these professional experiences and my own personal history and connection to Latin America which I will speak to later, I can say that we are indeed at a unique point in time of our relationship with Latin America, or as President Obama and Secretary Clinton, have called it, a moment of opportunity.
Evolution of the Relationship since the Alliance for Progress
To be sure, this moment isnt defined by one event or one set of circumstances. Instead its a product of the knowledge and perspective weve gained in the nearly 50 years since President Kennedy laid out a vision of economic cooperation in the Western Hemisphere that was united by history and experience and by our determination to advance the values of American civilization.
I mention the Alliance for Progress not to debate its successes or shortcomings, nor to revisit historic controversies.
Instead, its an opportunity to reflect on the dynamic development of the Latin American economies and political institutions of the last 50 years, take stock of the changed landscape, note the progress made, the lessons learned and acknowledge the challenges that still remain, while endeavoring to do better.
In taking stock of this changed landscape between the Americas, we need only look to the over half-trillion dollars in traded merchandise each year, the U.S. remaining largest foreign investor in the region, oil imports from Latin America exceeding those from the Middle East, and the significant migration to North America from Latin America to see that our economic and social ties are closer than ever.
While some aspects our relationship are marked by more interconnection, this progress has also led to a diversity of national interests and ambitions throughout Latin America. Nations considered developing only a few generations ago, now take center stage in international forums like the G-20, they help lead dialogues on global challenges like the financial crisis and climate change, while others have developed strategic partnerships beyond the Western Hemisphere. Subsequently our interests and perspectives do not always align.
But despite all of these changes, traditional challenges linked to economic inequality, energy insecurity, weak civil institutions continue to persist throughout the Americas.
Our ability to effectively meet those challenges is the moment of opportunity I spoke to. While our continued strong partnership holds enormous potential for progress and cooperation, it requires an acknowledgement that old framework of patron and client, marked by rigid and uniform Pan-American policies which defined our relationship for so long, is not compatible with the reality of modern Latin America.
The President seized this moment and has outlined a vision of this cooperation in his first major visit to Latin America in which he stated that there was no senior partner and junior partner in our relations; there is simply engagement based on mutual respect and common interests and shared values.
Critically important in this vision of partnership is the acknowledgment that while United States can be an indispensible partner in meeting these national and regional challenges, we cannot solve them on our own. We want and require fully engaged partners to help identify the areas of cooperation where partnership will yield meaningful progress.
Models of Partnership and Economic Cooperation
It is this model of partnership, in particular economic cooperation that I would like to speak to today because I believe that the most pressing challenges we seek to address, whether its addressing income inequality, energy security, or civil reforms that enable governments to better meet the needs of its citizens, are rooted in fundamentally economic matters.
In most instances, the scopes of these challenges require partnerships with the private sector to cultivate vibrant and open environments in emerging economies that enable trade, investment, and entrepreneurship.
To be clear, this is not simply a blind faith in the power of the free markets. Instead, this focus is really about identifying every convergence point where commercial and public interests meet.
We see this convergence of profit and purpose with several initiatives and concepts we are promoting in the spirit of partnership and cooperation laid out by the President.
- FIRST, our innovative initiative to harness remittances for development needs,
- SECOND; our emphasis on womens entrepreneurship in Peru, and
- THIRD, I want to speak to the need to promote anti-corruption and transparency measures as a way to boost domestic revenues for development
BRIDGE
The (Building Remittance Investment for Development, Growth and Entrepreneurship) or BRIDGE initiative is an example this new model of partnership between governments, multi-lateral institutions and the private sector to address a very public challenge, the lack of capital to meet the vast investment needs in critical growth sectors like infrastructure.
These investments are especially critical in emerging economies. Their trade and economic growth opportunities will be wasted if their aging ports cannot support increased traffic or cargo or if outdated electricity plants and ancient transmission grids cant power new factories and put lights in classrooms.
But too often, governments cannot commit the resources necessary for adequate infrastructure improvement while private institutions have a hard time accessing the affordable, long-term capital they need to support these larger projects.
BRIDGE attempts to address this financing problem by focusing on maximizing the impact of one of the largest and significant sources of foreign exchange in emerging economies: migrant remittances.
Consider this: Latin American workers in the U.S. send home over $60 billion in remittances each year, a figure that dwarfs foreign assistance. In BRIDGEs pilot countries-- Honduras and El Salvador -- remittances account for nearly a fifth of GDP.
But the true economic benefit of remittances is blunted with over 85% going to meet vital, yet short-term living expenses like food and shelter, with little being used to secure future economic growth. Its used for immediate consumption, rather than put to work building the economy.
BRIDGE is focused on replicating the success of financial institutions in Mexico, Brazil and Peru who have utilized their remittance flows to access lower-cost and longer-term capital. In fact, banks in those countries and in others like them have raised over $15 billion in capital secured by the remittance flows. The concept is similar to what our banks do with the money we deposit in our accounts: They use it to make loans and raise capital, but its always there for you to take out if you need it.
The BRIDGE partnership brings the resources of the State Department, the U.S. Agency for International Development (USAID), the Overseas Private Investment Corporation (OPIC), and the Inter-American Development Bank (IDB) to bear on these opportunities, in close collaboration with the host governments and private banks in those countries.
Our hope is that if this model works in Central America, we can scale up the BRIDGE approach and apply it in other parts of the Americas and the world.
Pathways Access Initiative - Peru
Another fertile area for cooperation is in promoting new economic opportunities rooted in the most American of values; entrepreneurship.
Under the Pathways to Prosperity initiative, were focusing on helping women-owned businesses reach larger markets by linking them with the reach of large companies in need of product diversification. But we arent just opening the doors for them. We are first teaching them the critical skills they will need to run a successful business and be competitive in the global marketplace. And we graduate these business owners with a certification thats as good as any good housekeeping seal of approval. Wal-Mart, who I believe is represented here today, recognized the mutual benefit of this program and has been an early and critical partner in getting this program off the ground. By identifying the needs of the corporations and linking them to qualified suppliers, especially the women entrepreneurs who drive much of the economic growth and business innovation in the region, we hope to create a self-sustaining mechanism for expanding trade and exports and another great framework of the partnership and collaboration between governments and businesses large and small.
Anti-Corruption and Transparency
Which brings me to the last area where we are starting to focus our labor. Despite the dynamic economic and political progress throughout Latin America, a legacy challenge in many countries has been integrating the economic elites into the formal revenue system. In other words, too many rich people arent paying their taxes resulting in untold billions of lost revenue. Last year in Quito, Secretary Clinton stated:
We cannot mince words on this. Levels of tax evasion are unacceptably high, more than 50 percent in some Latin American economies.To be clear, I dont think its simply a matter or greed or indifference. Many tax systems are ineffective and inefficient in much of the hemisphere. People wont pay their taxes if they see clouded budget processes coupled with corruption and inefficiencies that drain revenue away from public investment and services. Enabling governments to apply several basic but fundamental reforms could be an effective way to reverse this trend and ensure a sustainable source of revenue that can meet development needs.
Those reforms include: a) improving budget transparency, b) combating corruption and c) mobilizing revenue for development investment. The Economic Bureau I lead at State has been working on this three legged stool for some time, and were looking at new ways to scale and integrate this work so that it can be taken up by governments and institutions badly in need of reform.
But you might be asking, do all these technical concepts fit together and what does it all mean in concrete terms? The best proof of this concept may be in Latin America itself.
Just several years ago, Medellin, Colombia was transformed under then-Mayor Sergio Farjado from the murder capital of the world into a safe, economically vibrant metropolis through several important reforms. Fajardo raised taxes, but first engendered the trust of the local business elite by opening up the citys accounting books to the public. They then saw that their taxes were reinvested in high visibility development projects, including new infrastructure, social services, and schools. Success bred success and more people participated in the tax system so that Medellin had the resources to make the public sector investments which led to the transformation. At the time, Mayor Fajardo stated simply:
We have improved transparency in the citys finances, so more people are paying their taxes. When businesses trust that we are not stealing, and they know that we are going to use their money effectively, they pay.And Medellin is not alone. Peru has increased tax revenues to spend more on social programs and public works roads and schools and Brazil has one of the highest tax-to-GDP ratios in the world today. We can make significant progress in encouraging these reforms with the right partnerships, and I hope that these examples will be become common throughout Latin America.
Conclusion
These are but a few of the ways we are working every day to maximize the convergence points of commercial and public developmental interests between profit and purpose. While the scope of these innovatives on their own is limited, they are indeed scalable, but more importantly they are clear examples that of what real partnership can achieve.
However, before I conclude, I would be remiss if I came to Miami and only spoke about policy without touching on what truly calls me to this work. For me these arent just simple initiatives sets of policy prescriptions, but a real way to truly engage a region that has been a part of every stage of my life. A few years ago I went back to Cuba with my father to see our hometown, Cienfuegos. It was a wonderful trip, just the two of us, to see where he had been born, and revisit where I had played as a child before coming over at the age of 11. And everywhere I saw children playing in the streets, some shirtless and shoeless, not fully aware of the enormous obstacles they will face as they grow up. And it became as clear as ever to me that for the grace of God and the courage of my parents, I could have been one of them.
As I travel around the world and see children dart around the cars to beg for a scrap of food, or farmers who cannot till their fields, I say I've seen this for too long. While there is much to celebrate about the Latin Americas economic development in recent years, these problems were there when I started working in the region 30 years ago. And too many of these problems are still here today. Too many of us in this audience have fled our countries of birth or have loved ones in the region who wish they were in our shoes right now. There is no question that we have to do better. We've got to use all the resources available to us, and work with the belief that this is not a zero-sum game, that if we can use our strengths to accelerate development in the region, we will also help ourselves as a nation.
The items Ive mentioned today demonstrate that the models of partnership we aspire to, require participation from all elements of society and challenges all of us here today as government, business, community and thought leaders, to develop and nurture these opportunities every day.
As always, I welcome your thoughts and ideas on how we can do better, to build security and prosperity that touches every part of the Americas, from Miami and Minnesota to Monterrey and Montevideo.
Thank you.
https://2009-2017.state.gov/e/eb/rls/rm/2011/156287.htm
Support our FIGHT AGAINST illegal immigration & Amnesty by joining our E-mail Alerts at https://eepurl.com/cktGTn
-
06-19-2018, 04:15 PM #17Moderator
- Join Date
- Apr 2016
- Posts
- 31,048
"As I travel around the world and see children dart around the cars to beg for a scrap of food, or farmers who cannot till their fields, I say I've seen this for too long. "
------------------------------------------
They need birth control and quality of life.
You cannot breed your way out of poverty and that is a fact.
We give them billions and until the World addresses the FACT of Global Population Control...all the money in the World will not help them.
Now they push their overbreeding poor over our borders and WE do not want it, we do not want to pay for it and we do not want it to continue here.
They are bringing down our quality of life because they continue to live their lives this way...we do not.
Send them back and give them a "Comprehensive Plan for Reform" outlining steps they MUST take to gain education, peace and prosperity. We cannot do it for them. And they cannot continue to come here.
Throwing more of our money at this problem solves nothing. They have to want change, have the will, and the sacrifice to implement it.
Coming here "for a better life" is a sad story and an excuse to get the free stuff. They do not have a better life here, they continue to breed more mouths they cannot feed and it sacrifices the quality of ours while we foot the bill.
This cannot continue across the planet in these failed countries...and we cannot allow it be brought here any more and affect ours.
Last edited by Beezer; 06-19-2018 at 04:20 PM.
ILLEGAL ALIENS HAVE "BROKEN" OUR IMMIGRATION SYSTEM
DO NOT REWARD THEM - DEPORT THEM ALL
-
06-19-2018, 06:31 PM #18Super Moderator
- Join Date
- May 2005
- Location
- Heart of Dixie
- Posts
- 36,012
Basically what the BRIDGE program does is pay these countries through US loans based on how much money their illegals are sending home. Remittance to El Salvador are 14 rimes the amount in come that they receive in US Foreign aid. So they have been pumping up here, with the help of Mexico (share the wealth with their S. American brothers and sisters) as fast as they can get them here since 2010.
Support our FIGHT AGAINST illegal immigration & Amnesty by joining our E-mail Alerts at https://eepurl.com/cktGTn
-
06-19-2018, 09:26 PM #19Senior Member
- Join Date
- Aug 2005
- Posts
- 55,883
It's money-laundering. Where is the FBI?
A Nation Without Borders Is Not A Nation - Ronald Reagan
Save America, Deport Congress! - Judy
Support our FIGHT AGAINST illegal immigration & Amnesty by joining our E-mail Alerts at https://eepurl.com/cktGTn
-
06-20-2018, 07:21 AM #20Moderator
- Join Date
- Apr 2016
- Posts
- 31,048
Originally Posted by Judy
Too busy trying to take down our President...that is where.ILLEGAL ALIENS HAVE "BROKEN" OUR IMMIGRATION SYSTEM
DO NOT REWARD THEM - DEPORT THEM ALL


 Reply With Quote
Similar Threads
-
US signs historic deal with El Salvador and Honduras for remittance securitization
By Newmexican in forum General DiscussionReplies: 13Last Post: 07-09-2015, 02:39 PM -
Senate Bill: Enough Green Cards for Everyone In Guatemala, Honduras, El Salvador
By florgal in forum General DiscussionReplies: 1Last Post: 07-22-2014, 01:05 PM -
U.S. BRIDGE Initiative Commitments with El Salvador and Honduras
By Newmexican in forum General DiscussionReplies: 2Last Post: 04-11-2014, 07:30 PM -
Killings in el salvador dip, raising questions of a deal
By JohnDoe2 in forum illegal immigration News Stories & ReportsReplies: 0Last Post: 03-25-2012, 06:19 PM -
Sheriff`s deal in Honduras defended
By FedUpinFarmersBranch in forum illegal immigration News Stories & ReportsReplies: 2Last Post: 05-25-2008, 12:21 PM


Mike Johnson betrays border security for more foreign aid
04-18-2024, 10:31 PM in illegal immigration News Stories & Reports