

Results 1 to 2 of 2
Thread Information
Users Browsing this Thread
There are currently 1 users browsing this thread. (0 members and 1 guests)
 LinkBack URL
 About LinkBacks
-
01-15-2014, 01:09 PM #1Senior Member


- Join Date
- Aug 2008
- Location
- PARADISE (San Diego)
- Posts
- 99,038
The Great Global Warming Swindle is itself a Fraud and a Swindle
Durango Bills
Debunking the Deniers of Global Warming
The Great Global Warming Swindle is itself a Fraud and a Swindle
by
Bill Butler
The Great Global Warming Swindle (DVD/video/movie) is a pseudo-documentary in which British television producer Martin Durkin has fraudulently misrepresented both the data involved and scientists who have researched global climate. Movie director Durkin has willfully misrepresented the facts about global warming just to advocate his own agenda. The program was originally aired on Englands Channel 4 (The Supermarket Tabloid of the airwaves). In the past, Channel 4 has had to broadcast a prime-time apology for broadcasting another of Martin Durkins sleazebag pseudo-documentaries.
The Great Global Warming Swindle is aimed at and appeals to the Dont bother me with the facts - Ive already made up my mind audience. There may be future media presentations by those who wish to promote ignorant political viewpoints instead of presenting factual knowledge. (Or possibly, the individuals involved have never passed a high school science course and dont understand that there is a difference.)
Martin Durkins modus operandi for the various versions of the DVD/video/movie appears to be:
1) I want to propagandize my anti-environment, anti-global warming agenda.
2) What kind of wild stories, manufactured evidence, etc. can I include this time to provide political fodder for the scientifically illiterate dimwits?
The one cardinal rule in science is that you do not misrepresent the data. But this is what the producer of this pseudo-documentary has done to try to promote his own opinions.
The picture-pairs that follow are Print Screen images from the video version of the pseudo-documentary vs. the factual data. At one time Google had a copy of the video athttp://video.google.com/videoplay?do...62022478442170 . All references refer to this Google Wag TV video version although it appears that it is no longer available at this link. There may be another slightly shorter version at: http://video.google.com/videoplay?do...47519933351566 Please search the Internet for other versions if this shorter version also disappears.
Viewers are encouraged to compare each of the picture-pairs below and draw their own conclusions as to whether the pseudo-documentary is based on factual data, or if the pseudo-documentary falsifies the data as part of an anti-environmental campaign. (See the 2nd half of the pseudo-documentary for the anti-environmental campaign.)
The Actual Recent Temperature Record
This first pair of pictures compares the partial temperature record as presented in The Great Global Warming Swindle vs. the actual observations as shown at NASAs Goddard Institute for Space Studies.
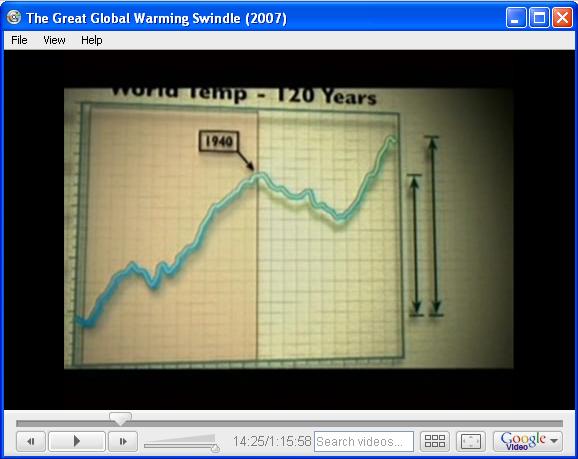
The vertical bars at the right are the pseudo-documentarys assertion that most of the recent rise in global temperatures occurred before 1940. The exact words from the pseudo-documentary are:
Most of the rise in temperature occurred before 1940. (About 14 min. 20 sec. into the presentation.)
Please take a close look at the right-hand portion of the graph.
The picture below shows the actual changes in the worlds temperature as presented by NASAs Goddard Institute for Space Studies. http://data.giss.nasa.gov/gistemp/graphs/
Again please take a close look at the right-hand portion of the graph. The pseudo-documentary version of the temperature graph omits the last 20 years of data. (And fluffed the graph to disguise this omission.) The rapid increase in world temperatures over the last 20 years has paralleled the rapid rise in carbon dioxide concentrations. However, the pseudo-documentary does not include this data. (Note: The slight cooling that took place from 1940 to the 1960s was caused by increasing sulfates in the atmosphere - see http://en.wikipedia.org/wiki/Image:C...ttribution.png )
The director of the pseudo-documentary has willfully omitted this most recent data because it would disprove the personal agenda that he is trying to promote. When anyone misrepresents real data to try to present a personal agenda, what he is doing is flat out
FRAUD!!
As defined by Merriam-Websters Dictionary of Law athttp://dictionary.reference.com/browse/fraudfraud - specifically : a misrepresentation or concealment with reference to some fact material to a transaction that is made with knowledge of its falsity or in reckless disregard of its truth or falsity and with the intent to deceive another
The GISS climate database is shown in the above chart. GISS is used as it covers the entire earths surface. Some of the Global Warming Deniers claim that GISS is not representative. The graph below shows the temperature records from all four of the major climate databases. (NASA/GISS, NOAA/NCDC, HadleyCRU, and JMA (Japan Meteorological Agency)) All four show similar temperature patterns including sharp warming in recent decades.
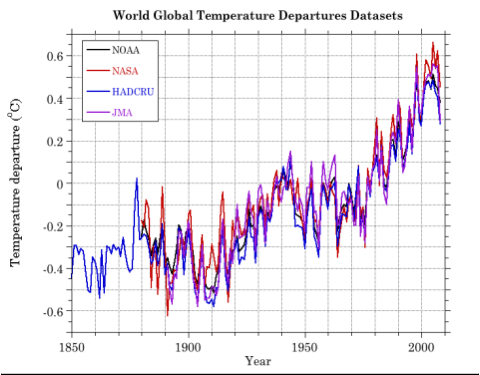
Note: After the relatively cooler year seen in 2008, temperature anomalies for 2009 are right back up near the record highs seen earlier this decade.
The Global Cooling Assertions
And what do the purveyors of the Global Warming Denial Machine say when you show them that the climate is warming? The following story, posted at DailyTech.com on Feb. 26, 2008, is typical. (Note the date.)Twelve-month long drop in world temperatures wipes out a century of warming
http://www.dailytech.com/Temperature...ticle10866.htm
In reality 2008 showed a temperature anomaly of +0.54 degrees C. http://data.giss.nasa.gov/gistemp/tabledata/GLB.Ts.txt
This makes 2008 the 9th warmest year in history. (2005 is the record warmest year with 2007 the 2nd warmest. - Please refer to the above graph.)
Accuweathers Joe Bastardi
The Global Cooling assertion by the Global Warming Deniers even extends to people who should know better. For example, Accuweathers Joe Bastardi has been claiming for years that the climate is cooling. In 2005 he said:A weather expert says December 2005 is on pace to become one of the 10 coldest in more than 100 years, despite claims at a global conference on climate change this week that the Earth is getting warmer.
Joe Bastardi, senior meteorologist with Accuweather.com, says present weather patterns across the country show below-normal temperatures in the single digits, with still colder air forecast in the coming weeks.
All told, he said, "the current look and pace may bring December 2005 in as a top 10 month for cold Decembers nationwide since the late 1800s."
http://www.worldnetdaily.com/news/ar...TICLE_ID=47887
In practice, Dec. 2005 turned out to be the 2nd warmest December on record (up through 2005).
Bastardi: CO2 cannot cause global warming. . . So it cannot -- it literally cannot cause global warming. This and other Bastardi bloopers at:http://www.skepticalscience.com/skep...e_Bastardi.htm
Does the phrase Out of touch with reality come to mind?
As the credit card ad says: Priceless
Joe Bastardi also appears to be guilty of unprofessional conduct in that his Global Warming Denial is part of a political agenda. For example, there is a chart that shows Global Cooling some 80 to 95 seconds into a Joe Bastardi video that can be seen athttp://www.youtube.com/watch?v=z6Y2iF99kOY . (A close-up of the chart can be seen athttp://icecap.us/images/uploads/SPPI8YR.jpg ) Note that the source of the chart (as seen in the close-up) is www.scienceandpublicpolicy.org.
The chart itself has several faults:
1) The source of the data is left as a mystery.
2) The time period of 1998 to present is much too short to be representative.
3) The starting year of 1998 is about a blatant example of cherry picking as you are ever going to get.
Additional info about the charts origin and misrepresentations including Not just wrong, fake. can be found at:
http://www.realclimate.org/index.php...-manipulation/
http://www.ossfoundation.us/projects...opher-monckton
For what its worth, Christopher Monckton and everything he asserts is thoroughly debunked at A Scientist Replies to Christopher Monckton http://www.stthomas.edu/engineering/jpabraham/ The slide show includes a debunking Moncktons graph(s). (More below.)
The actual label on the graph is www.scienceandpublicpolicy.org. Science and Public Policy is basically a one-man operation run by a long-time Republican staffer named Robert Ferguson. http://scienceandpublicpolicy.org/contact.html
The following information about Robert Ferguson and the Science and Public Policy Global Cooling graph can be seen at:
http://www.desmogblog.com/the-endocr...-dc-think-tankNotes on the Science and Public Policy Global Cooling graph.
(Run by Robert Ferguson)
The Science and Public Policy Institute (SPPI) was founded by a long-time Republican staffer named Robert Ferguson. According to the SPPI website, Ferguson "has 26 years of Capitol Hill experience, having worked in both the House and Senate. He served in the House Republican Study Committee, the Senate Republican Policy Committee; as Chief of Staff to Congressman Jack Fields (R-TX) from 1981-1997, Chief of Staff to
Congressman John E. Peterson (R-PA) from 1997-2002 and Chief of Staff to Congressman Rick Renzi (R-AZ) in 2002.
Until recently, Ferguson worked for an oil-industry funded think tank called Frontiers of Freedom. The Frontiers of Freedom are one of the most active groups in the attack on climate science and have received over $1 million in grants from oil giant ExxonMobil.
As for Joe Bastardis (not factual) knowledge of past climates, on multiple occasions he has stated:
The Vikings were raising grapes on the north coast in Newfoundland.
http://newsbusters.org/blogs/jeff-po...-re-going-be-w
http://baroclinic.blogspot.com/2009/...imategate.html
In reality, the only known Viking settlement in North American was at L'Anse aux Meadows, and this was used as a staging ground for expeditions that extended as far south as Nova Scotia.
The L'Anse aux Meadows site is not Vínland.
http://www.hurstwic.org/history/arti...xploration.htm
Although L'Anse aux Meadows is not Vinland
http://www.pc.gc.ca/eng/lhn-nhs/nl/m...l/vinland.aspx
Bastardis claim that it was warm enough 1,000 years ago to grow grapes in northern Newfoundland is simply an arrogant fantasy.
In summary, Joe Bastardi is promoting a political agenda from a person who has 26 years of Capitol Hill experience instead of sticking to the science of meteorology.
Also, please see: Meteorological Malpractice: Accuweathers Joe Bastardi pushes the 70s Ice Age Scare myth again
http://climateprogress.org/2010/01/0...-myth-science/
Accuweathers meteorologist Joe Bastardi likes to push anti-science global cooling conspiracy theories
Some of the Global Warming Deniers cherry pick a short time period from the HadCRUT 3V database to claim that the world has been cooling since 1998. This is willfully misleading for several reasons.
1) The short time period is not representative.
2) The starting date is obvious cherry picking.
3) HadCRUT 3V does not include the Arctic Ocean/North Pole area. GISS does include the Arctic. GISS is a better database as it includes a larger area. Warming has been greatest over the Arctic which is why GISS data shows more warming than HadCRUT 3V. There is more information on this difference at:
http://www.realclimate.org/index.php.../mind-the-gap/
Christopher Monckton
While Christopher Monckton did not appear in Durkins movie, he has promoted it. ( Please see paragraph 5 at:http://www.timesonline.co.uk/tol/new...cle2652851.ece ) He is also one of the leading lights (dimwits) of the Global Warming Denier movement. As is typical of Global Warming Deniers, Christopher Monckton is an expert at making noise and scientifically impaired when it comes to portraying reality. (Great qualifications if you want to be a politician or circus side show barker.)
The following two pictures illustrate how Christopher Monckton misrepresents reality.
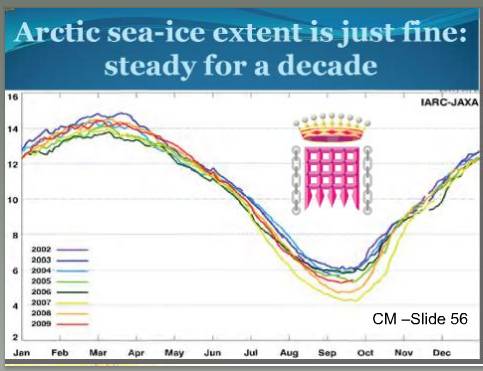
(Also see slide 56 athttp://www.friendsofscience.org/asse...ckton_2009.pdf )
The picture above is from John Abrahams presentation: A Scientist Replies to Christopher Monckton http://www.stthomas.edu/engineering/jpabraham/ The picture is a copy of a slide used in one of Moncktons presentations where Monckton states that the Arctic sea-ice extent is just fine: steady for a decade. The picture shows the typical SEASONAL (winter to summer) changes in ice coverage. The seasonal pattern is relatively large as compared to the slower changes due to Global Warming/Climate Change, and thus the longer term decrease in the ice pack is not readily apparent.
(As for Moncktons inclusion of the crown icon on his chart, try
http://www.google.com/search?sourcei...ton+narcissism
and see what happens.)
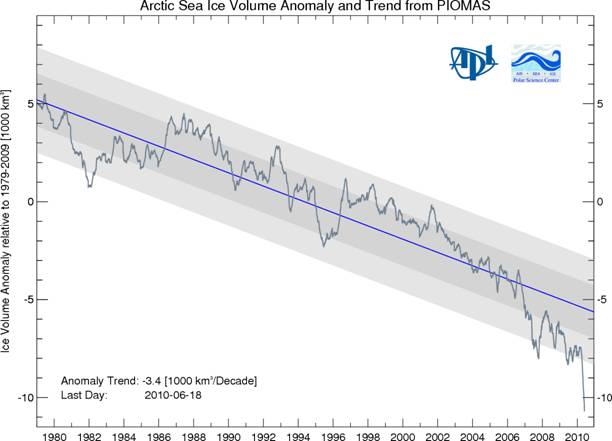
The picture above is from the University of Washingtons Applied Physics Laboratory, and shows yearly Arctic Ice Pack volume anomalies. http://psc.apl.washington.edu/Arctic.../IceVolume.php The volume of Arctic sea ice is actually declining rapidly with the trend accelerating. Moncktons description of this decline is: Arctic sea-ice extent is just fine: steady for a decade
In the world of Global Warming Deniers, it appears that blatant lying and bullyism are considered to be virtues when you are trying to force your political agenda down everyone elses throat.
Illustration: Glen Le Lievre
For more info on Moncktons lies, please see:
Monckton lies again (and again, and again, and again, and again . . .)!
http://timpanogos.wordpress.com/2009...er-of-fiction/
Debunking the myths behind the pontificating potty peer
http://www.theage.com.au/opinion/soc...0205-nikc.html
and
Christopher Monckton - A vociferous Global Warming Denier Liar
http://www.durangobill.com/GwdLiars/...rMonckton.html
The Myth of the 1970s Global Cooling Scientific Consensus
The following is a quote from the American Meteorological Society.
http://ams.allenpress.com/perlserv/?...2008BAMS2370.1An enduring popular myth suggests that in the 1970s the climate science community was predicting global cooling and an imminent ice age, an observation frequently used by those who would undermine what climate scientists say today about the prospect of global warming. A review of the literature suggests that, on the contrary, greenhouse warming even then dominated scientists' thinking as being one of the most important forces shaping Earth's climate on human time scales. More importantly than showing the falsehood of the myth, this review describes how scientists of the time built the foundation on which the cohesive enterprise of modern climate science now rests.

The graph above shows monthly temperature anomalies starting with Jan.1975 using data from NASAs Goddard Institute for Space Studies.http://data.giss.nasa.gov/gistemp/ta...LB.Ts+dSST.txt
The Global Warming Deniers claim that the world has been cooling this decade. The graph shows that The Deniers are willfully misrepresenting the actual observations. Misrepresentations and willfully false claims by the Global Warming Deniers are their standard mode of operation. The 12-month average is setting new records as of the first half of 2010.
The Historical Temperature Data vs. Carbon Dioxide & Methane
1 min. 15 seconds into the pseudo-documentary the following statement is made: We cant say that CO2 will drive climate, it certainly never did in the past.
The scientific record shows that the above statement is completely false, and discredits the person making it (Ian Clark). The record shows there is a strong correlation between past levels of carbon dioxide and methane vs. the earths temperature.
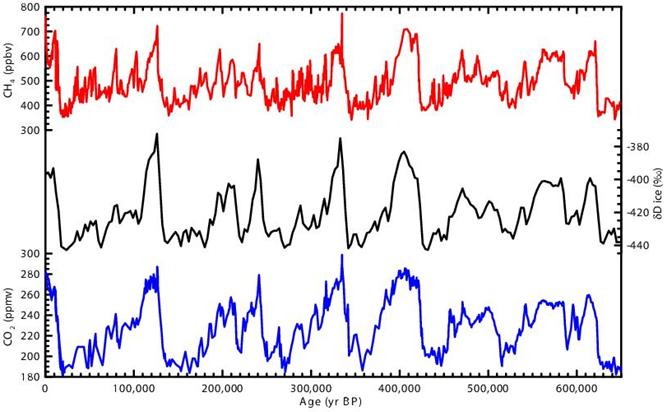
The original version of the above chart can be found athttp://www.realclimate.org/epica.jpg. It is derived from multiple ice cores that record atmospheric conditions and climate for the last 650,000 years. (Wikipedia has a similar version plus additional charts at http://en.wikipedia.org/wiki/Image:C...ature-plot.svg )
The black center line in the chart measures deuterium (hydrogen isotope) ratios found in the old ice. (Deuterium ratios are a stand-in for the historical temperature.) The red line shows methane levels while the blue line shows carbon dioxide ratios.
For comparative purposes, the current CO2 ratio in the earth's atmosphere is in excess of 380 parts per million and is climbing steeply. If this current ratio were plotted, it would be at the left end of the blue line, and far above anything seen in the previous 650,000 years. We are running an uncontrolled experiment with our atmosphere.
The 800-Year Time Lag
About 23 minutes into the pseudo-documentary, an assertion is made that carbon dioxide is not responsible for global warming because ice records show there have been several instances where warming has begun some ~800 years before carbon dioxide levels begin to increase. The actual 800-year lead is true, but the conclusion presented in the pseudo-documentary is not true.
As pointed out by Jeff Severinghaus (Professor of Geosciences, Scripps Institution of Oceanography, University of California, San Diegohttp://www.realclimate.org/index.php...2-in-ice-cores ), historical warm-up periods begin via some variable event that starts a warming cycle. For example, in the past, these initializing events were usually set off by Milankovitch variations in the earths orbit that changed the amount of sunshine reaching the ground in the northern hemisphere. This time, the initialization event has been a human induced spike in carbon dioxide concentrations. (Of note, the article at the above URL is dated as of Dec. 3, 2004 which is more than 2 years before Durkins pseudo-documentary was released.)
In turn, the initial warming event triggers a chain reaction/feedback release of carbon dioxide (blue line in the above chart) and methane (red line in the above chart) from the earths oceans, which then drives the rest of the warm-up cycle. Please see Jeff Severinghaus article
What does the lag of CO2 behind temperature in ice cores tell us about global warming?
at the above web page for more information.
Alternately please see a longer article:
The lag between temperature and CO2. (Gores got it right.) by Eric Steig
http://www.realclimate.org/index.php...-temp-and-co2/
Milankovitch Cycles
The ~100,000 year periodic cycles that can be seen in the above chart appear to be closely correlated with changes in the amount of summertime heat energy (insolation) at high latitudes in the Northern Hemisphere. (This in turn drives ocean currents starting with the North Atlantic Ocean.)
The most recent Milankovitch analysis indicates this forcing factor would have produced cooling for the last 6,000 years, but changes for the next few thousand years will be relatively minor. If Milankovich cycles were the sole contributor, we would be experiencing a relatively cool climate now instead of the observed rapid warming that has taken place over the last 100 years. For further information, please see:http://en.wikipedia.org/wiki/Milankovitch_cycles ; and in particular please see the red line in the chart at: http://en.wikipedia.org/wiki/File:In...olstice65N.png
Finally, it should be noted that changes in the earths orbit and rotational wobble have a time factor measured in thousands of years. The rapid warming that has been observed over the last 100 years is well below the threshold that could be produced by Milankovitch cycles.
Sunspots
Another assertion in the pseudo-documentary is that sunspots are responsible for global warming. The pseudo-documentary cant make up its mind whether to assert that its sunspots, or some indeterminate Solar Activity that is causing changes in temperature; but we will present the pseudo-documentarys Solar Activity chart and compare it with the historical sunspot record.
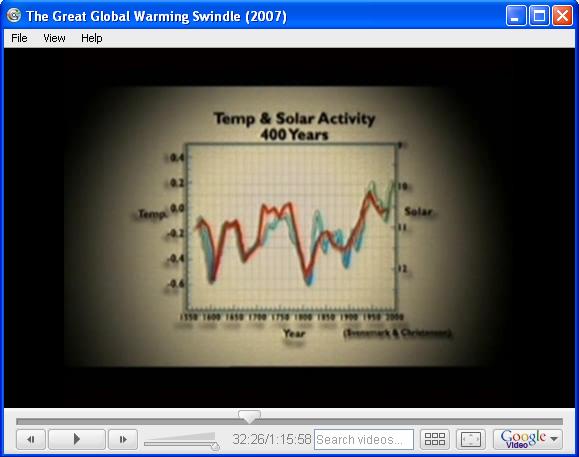
The Print Screen image above shows the pseudo-documentarys Solar Activity chart. The blue-green line shows the temperature for most of the last 400 years. Again, the films producer has omitted the steep warming seen in the last 20 years. If the chart had included this recent warming, the blue-green line would have run off the top of the chart. (See the first pair of pictures.)
The red line is purported to depict Solar Activity. If whatever the pseudo-documentary chose to represent as Solar Activity had any correlation to observed temperatures, then the red line should have spiked just as the recent temperature has. Of course the red line is conveniently not plotted for the last few decades.
The red line may have been based on original work by Nathan Rive and Eigil Friis-Christensen. They have issued a joint statement stating that the red line data was made up of fabricated data that was presented as genuine.
http://folk.uio.no/nathan/web/statement.htmlRegarding: The Great Global Warming Swindle, broadcast in the UK on Channel 4 on March 8, 2007
We have concerns regarding the use of a graph featured in the documentary titled Temp & Solar Activity 400 Years. Firstly, we have reason to believe that parts of the graph were made up of fabricated data that were presented as genuine. The inclusion of the artificial data is both misleading and pointless it incorrectly rules out a contribution by anthropogenic greenhouse gases to 20th century global warming.
Ian Clark (The spokesman for the earlier discredited quote: We cant say that CO2 will drive climate, it certainly never did in the past.) supports this incorrect solar/sunspot conjecture. http://www.canada.com/nationalpost/f...c-60b13b2ba764
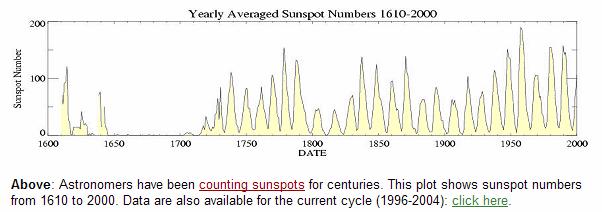
The chart above is an excerpt from NASAs Solar Cycle Update athttp://science.nasa.gov/headlines/y2...larminimum.htm.
It shows the actual number of observed sunspots over the last 400 years. (The number of sunspots has been counted for the last 400 years, and this record is our only direct measurement of Solar Activity for this time span.) The actual information as shown above doesnt resemble the red line in the pseudo-documentary. The source data for the red line in the pseudo-documentary thus remains a mystery.
If short term temperatures followed a sunspot cycle, we should see similar short term temperature oscillations that correspond to the ~11 year sunspot cycle. No short term correlation exists. The pseudo-documentary tries to correlate the minor 1940 top in temperatures with the number of sunspots. A quick look at the sunspot chart shows no 1940 correlation. Similarly, if sunspots were responsible for the large observed increase in world temperatures over the last few decades, then there should also be some unusual anomaly in the sunspot pattern over the same last few decades. No such anomaly exists.
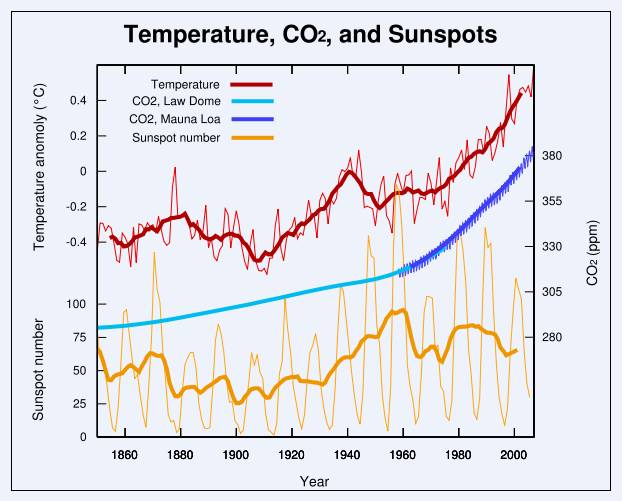
The above chart is from Stanford Universitys Solar Center. http://solar-center.stanford.edu/sun...glob-warm.html
The sharp warming in the earths temperature over the last several decades is following the increase in the atmospheric carbon dioxide content. The warming trend is not following sunspot activity.
Global warming . . . is now well documented and accepted by scientists as fact.
Solar Irradiance
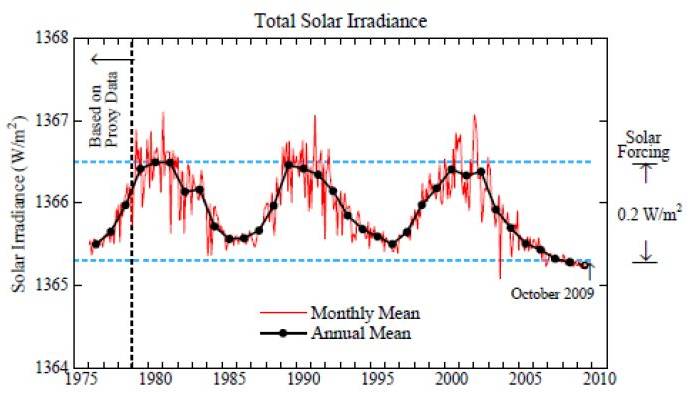
Solar Irradiance through October 2009, based on concatenation of multiple satellite records by Claus Frohlich and Judith Lean (see Frohlich, 2006). Averaged over day and night, Earth absorbs about 240 W/m2 of energy from the sun, so the irradiance variation of about 0.1 percent causes a direct climate forcing of just over 0.2 W/m2.
Original graph from: http://theenergycollective.com/TheEn...llective/55125
Solar Irradiance (Unobstructed heat energy from the sun) has been measured by satellites for over 30 years. As seen in the above graph, there has been no significant increase in solar radiation that could account for the increase in the earths temperature over the last few decades. The cyclical pattern in the above graph closely approximates the sunspot cycle.
A recent study of solar radiation was released July 11, 2007
Solar variations not behind global warming: studyhttp://www.reuters.com/article/scien...01501320070710
Solar activity cleared of global warming blame
http://www.theage.com.au/news/nation...833599508.html
The original research report (published in the Proceedings of the Royal Society - highly technical) is at:
http://www.pubs.royalsoc.ac.uk/media...pa20071880.pdf
Recent oppositely directed trends in solar climate forcings and the global mean surface air temperature
This most recent research study indicates that solar irradiance has actually decreased slightly since the mid 1980s. (Which is what can be seen in the NASA solar irradiance measurements.)
 These two chart pairs from pages 5 and 7 of the above report show that solar irradiance is not responsible for the sharp increase in observed world temperatures over the last few decades. (TSI = Total Solar Irradiance, ΔT = observed temperature anomaly) In the first pair of graphs, the ~11 year sunspot cycle overwhelms directly observable longer term changes in irradiance, while random temperature fluctuations add a lot of jiggles to the temperature graph.
In the second pair of graphs, the sunspot cycle has been subtracted out and temperature data has been smoothed. In the smoothed temperature chart, GISS is Goddard Institute for Space Studies (NASA) data while HadCRUT3 is data from Englands Hadley Center for Research. The red line in the irradiance chart shows the resultant best fit while the other lines reflect various damping factors.
As shown in the charts, not only have temperatures continued to rise since 1985, the rate of temperature increase is accelerating. Total solar irradiance (total solar radiated energy) has slightly decreased during this period. Thus solar irradiance is clearly not responsible for the recent increase in the earths temperature.
The report also examines sunspot counts, length of the sunspot cycle, solar magnetic flux, and cosmic rays as part of the study. The reports conclusion is:Our results show that the observed rapid rise in global mean temperatures seen after 1985 cannot be ascribed to solar variability, whichever of the mechanisms is invoked and no matter how much the solar variation is amplified.
Also, Changes in Solar Brightness Too Weak to Explain Global Warming
http://www.ucar.edu/news/releases/2006/brightness.shtml
The Denial Industry / Denial Machine
 Yet the only real evidence that the deniers (and their well-funded Denial Industry / Denial Machine ) can demonstrate is that they are not mentally capable of understanding real evidence. Note: The Denial Machine video includes Fred Singers (see below) assertion that tobacco smoke is not a health hazard.
Also, as part of their campaign, the deniers continue to churn out fabricated/manufactured evidence that has no factual basis. Please see Newsweeks Aug. 13, 2007 cover story - The Truth About Denial - for additional information.
http://www.newsweek.com/id/32482
(The article is a lengthy documentation of the what/why/when of the Denial Machine, who is financing it, and how it is flooding the world with disinformation to obfuscate the real evidence of global warming (climate change).)
(If you dont understand the above cartoon, you need to see the Creationism = Willful Ignorance page.)
A quote from http://currentera.com/SwindlersList.html
Ok, so now we know that Durkin admittedly has no problem with fudging charts and graphs to meet his own ends
There is much more at this web site.
The low activity in sunspots from 1650 to 1700 is of interest. This dip in sunspot activity is called the Maunder Minimum in honor of astronomer E. W. Maunder. There appears to be some correlation with historical temperatures as this period coincided with the Little Ice Age. However, if this correlation were stronger, then temperatures should have maxed out with the late 1950s peak in sunspots. This is not what we observe in the temperature records. Thus sunspots are not the cause of the sharp global warming we have seen in the last few decades.
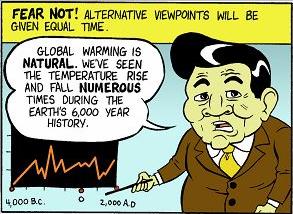
The chart above fromhttp://en.wikipedia.org/wiki/Image:1...Comparison.png shows a composite of 10 different temperature reconstructions over the last 1000 years. The Maunder Minimum does coincide with the lowest temperature readings, but it is a loose fit at best, and may be coincidental. Of note, the Medieval Warm Period was not as warm as current temperatures. (This refutes the graphic shown in the pseudo-documentary which claims the Medieval Warm Period was warmer than present temperatures.)
The medium blue line that starts at the left edge in the above chart is Michael Manns original Hockey Stick. Michael Manns temperature reconstruction has been confirmed by other temperature reconstructions which indicates that he has had it right all along.
A major research work that was published in 2013 has again reconfirmed the original work by Michael Mann. http://thinkprogress.org/climate/201...-hockey-stick/
(All data are freely available includes link)
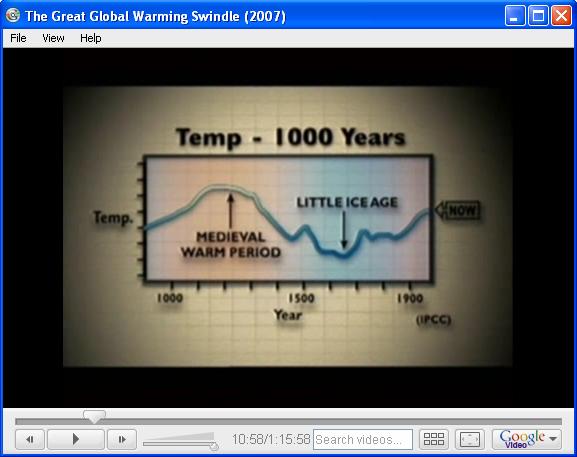
Gabriel Fahrenheit invented the modern thermometer in the early 1700s. Thus early temperatures have to be reconstructed by indirect methods as shown in the preceding Reconstructed Temperature picture. The graph shown in the pseudo-documentary is not based on accurate data.
Cosmic Rays
At about 33 minutes into the pseudo-documentary, there is an assertion that cosmic rays generate clouds that in turn cause changes in the earths temperature. This assertion is refuted by the following article published by the American Geophysical Union.
http://www.agu.org/sci_soc/prrl/prrl0405.html (Summary only)
http://www.pik-potsdam.de/~stefan/Pu...l_eos_2004.pdf (Full text)
Cosmic Rays Are Not the Cause of Climate Change, Scientists Say
Eleven Earth and space scientists say that a recent paper attributing most climate change on Earth to cosmic rays is incorrect and based on questionable methodology. Writing in the January 27 issue of Eos, published by the American Geophysical Union, Stefan Rahmstorf of the Potsdam Institute for Climate Impact Research and colleagues in Canada, France, Germany, Switzerland, and the United States challenge the cosmic ray hypothesis.
The authors of the above research conclude that the cosmic ray hypothesis is incorrect and based on questionable methodology and is scientifically ill-founded.
The assertion in the pseudo-documentary may well be based on this discredited cosmic ray hypothesis.
If you want to look at cosmic ray measurements for the last 50 years, you can see the actual data at ftp://ftp.ngdc.noaa.gov/STP/SOLAR_DA...AYS/climax.tab. The solar wind is stronger during periods of high sunspot activity which in turn reduces the number of cosmic rays that can reach the earth. Thus there is an 11-year inverse correlation with the sunspot cycle.
The chart above illustrates the average hourly cosmic ray count rate (1,000s per hour) for each year beginning in 1953 as measured at the high altitude observatory in Climax, Colorado. (Data is from the above web link. 2006 data is a preliminary average for the first 11 months.) The pseudo-documentarys cosmic ray conjecture states that high cosmic ray intensities produce more clouds which would produce cooler earth temperatures. If this conjecture were true, then we should see a corresponding 11-year cycle in the earths temperature. If we compare this chart with the actual temperature record (the NASA/GISS temperature record shown earlier), there is no apparent correlation.
Volcanoes
At about 25 minutes 18 seconds into the pseudo-documentary, the video/film shows an animated cartoon of a volcano and asserts that volcanoes emit more carbon dioxide than human induced emissions. The exact quote from the pseudo-documentary is:Volcanoes produce more CO2 each year than all the factories and cars and planes and other sources of man-made carbon dioxide put together.
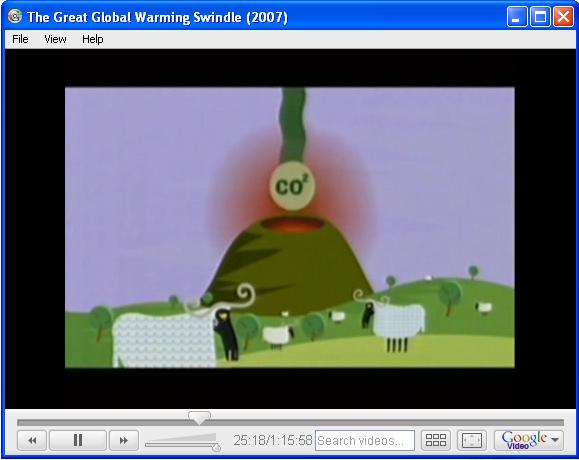
Once again the pseudo-documentary willfully falsifies the facts. The following quote is from the U. S. Geological Survey.http://volcanoes.usgs.gov/Hazards/Wh...as/volgas.html
Comparison of CO2 emissions from volcanoes vs. human activities.
Scientists have calculated that volcanoes emit between about 130-230 million tonnes (145-255 million tons) of CO2 into the atmosphere every year (Gerlach, 1999, 1991). This estimate includes both subaerial and submarine volcanoes, about in equal amounts. Emissions of CO2 by human activities, including fossil fuel burning, cement production, and gas flaring, amount to about 27 billion tonnes per year (30 billion tons) [ ( Marland, et al., 2006) - The reference gives the amount of released carbon (C), rather than CO2, through 2003.]. Human activities release more than 130 times the amount of CO2 emitted by volcanoes--the equivalent of more than 8,000 additional volcanoes like Kilauea (Kilauea emits about 3.3 million tonnes/year)! (Gerlach et. al., 2002)
Also, from a paper presented at the Geological Society of Americas 2010 meeting:
This anthropogenic CO2 emission rate is ~100-300 times larger than the estimate ranges for annual global volcanic CO2 release.
http://gsa.confex.com/gsa/2010AM/fin...act_178855.htm
The graph above was originally posted at http://www.skepticalscience.com/volc...termediate.htm The graph shows the atmospheric concentration of Carbon Dioxide as measured at Mauna Loa, Hawaii vs. Stratospheric Aerosol concentrations from volcanic eruptions.
Q. If volcanoes were the primary contributor to atmospheric carbon dioxide, why arent there spikes in the atmospheric CO2 concentrations that correspond with major volcanic eruptions?
A. As per usual, the Global Warming Deniers lie about reality.
(Note: The 1980 eruption of Mt. St. Helens caused barely a minor bump in aerosols.)
Misrepresentation of statements by scientific experts
The pseudo-documentary The Great Global Warming Swindle also abusively uses cut and paste, out-of-context statements by at least one legitimate scientist. The result willfully misconstrues the original meaning to instead promote the producers agenda. The following are statements by Carl Wunsch, professor of physical oceanography at the Massachusetts Institute of Technology and are posted at:http://www.celsias.com/blog/2007/03/...rming-swindle/
Climate scientist duped to deny global warming
A Leading US climate scientist is considering legal action after he says he was duped into appearing in a Channel 4 documentary that claimed man-made global warming is a myth. Carl Wunsch, professor of physical oceanography at the Massachusetts Institute of Technology, said the film, The Great Global Warming Swindle, was grossly distorted and as close to pure propaganda as anything since World War Two.
He says his comments in the film were taken out of context and that he would not have agreed to take part if he had known it would argue that man-made global warming was not a serious threat. I thought they were trying to educate the public about the complexities of climate change, he said. This seems like a deliberate attempt to exploit someone who is on the other side of the issue. He is considering a complaint to Ofcom, the broadcast regulator. - Guardian
Professor Wunsch said: I am angry because they completely misrepresented me. My views were distorted by the context in which they placed them. I was misled as to what it was going to be about. I was told about six months ago that this was to be a programme about how complicated it is to understand what is going on. If they had told me even the title of the programme, I would have absolutely refused to be on it. I am the one who has been swindled. - Independent
The above web site has multiple other links that refute the assertions made in the pseudo-documentary.
A complete listing of MITs Professor Carl Wunsch's comments on the pseudo-documentary can be found at:
http://ocean.mit.edu/~cwunsch/CHANNEL4.html
The Other Experts in the Program
The pseudo-documentary implies that the other people who appeared are knowledgeable experts in their fields. In practice, their best expertise seems to be wrangling payments from large energy companies - especially anti-environmental organizations. The following list of brief biographies is a long quote from:
http://climatedenial.org (Original posting will scroll downward)
http://climatedenial.org/2007/03/09/...-four-swindle/Fred Singer. Despite the caption on the programme, Singer has retired from the University of Virginia and has not had a single article accepted for any peer-reviewed scientific journal for 20 years. His main work has been as a hired gun for business interests to undermine scientific research on environmental and health matters. Before turning to climate change denial he has argued that CFCs do not cause ozone depletion and second hand smoke does not cause cancer (more ). In 1990 he founded The Science and Environment Policy Project, which aggressively contradicts climate science and has received direct funding from Exxon, Shell, Unocal and ARCO. Exxon is also among the funders ($20,000 in 1998 and 2000)
Patrick Michaels is the most prominent US climate change denier. In the programme he claimed Ive never been paid a nickel by the old and gas companies which is a curious claim. According to the US journalist Ross Gebspan Michaels has received direct funding from, among others German Coal Mining Association ($49,000), Edison Electric Institute ($15,000), and the Western Fuels Association ($63,000) an association of US coal producing interests (more ). The WFA is one of the most powerful forces in the US actively denying the basic science of climate change, funding, amongs other things, the Greening Earth Society which is directed by Patrick Michaels. Tom Wigley, one of the leading IPCC scientists, describes Michaels work as a catalog of misrepresentation and misinterpretation. (More on Michaels )
Philip Stott was captioned as a Professor at the University of London although he is retired and is therefore free of any academic accountability. Stott is a geographer by training and has no qualifications in climate science. Since retiring Stott has aimed to become Britains leading anti-green pundit dedicating himself to wittily criticizing rainforest campaigns (with Patrick Moore), advocating genetic engineering and claiming that global warming is the new fundamentalist religion.
Patrick Moore is Stotts Canadian equivalent. Since a very personal and painful falling out with Greenpeace in 1986 Moore has put his considerable campaigning energies into undermining environmentalists, especially his former friends and colleagues. Typical of his rhetoric was his claim in the programme that environmentalists were anti-human and treat humans as scum. Throughout the 1990s Moore worked as lead consultant for the British Columbian Timber Products Association undermining Greenpeaces international campaign to protect old growth forest there. Whenever he has the chance he also makes strong public statements in favour of genetic engineering, nuclear power, logging the Amazon, and industrial fishing- all, strangely, lead campaigns for Greenpeace (more on Moore..)
Piers Corbyn has no academic status and his role in such programmes is to promote his own weather prediction business. He has steadfastly refused to ever subject his climatological theories to any form of external review or scrutiny.
Richard Lindzen. As a Professor of Meteorology at the credible Massachusetts Institute of Technology, Lindzen is by far the most reputable academic among the US climate deniers and, for this reason, he is heavily cited by sympathetic journalists such as Melanie Phillips and Michael Crichton. His arguments though are identical to the other deniers for example an article in the Wall Street Journal (June 11 2001) he claims that there is no consensus, unanimous or otherwise, about long-term climate trends or what causes them.
He is strongly associated with the other people on the programme though co-authored reports, articles, conference appearances and co-signed statements.
Tim Ball was captioned as the University of Winnipeg. In fact he left in 1996 and since then he has run political campaigns through two organisations he helped found: the Natural Resources Stewardship Project and the Friends of Science which, according to their websites aim to run a proactive grassroots campaign to counter the Kyoto Protocol; and encourage and assist the Canadian Federal Government to re-evaluate the Kyoto Protocol. Ian Clark is also on the board of the NRSP.
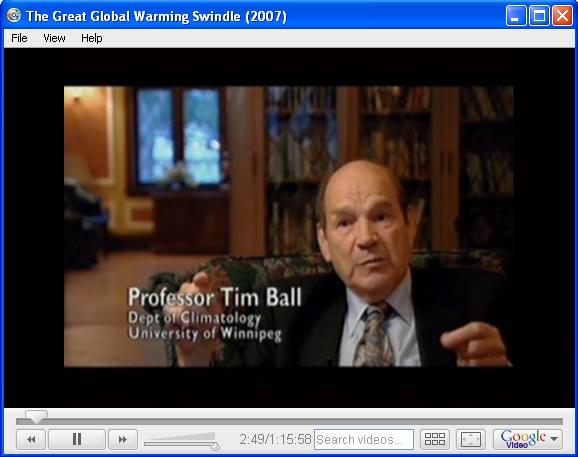
As to the claim that Tim Ball is/was a professor in the Climatology Department at the University of Winnipeg, the University of Winnipeg has never had a Department of Climatology http://en.wikipedia.org/wiki/The_Gre...arming_Swindle.
As quoted by the Defendants (the Defendants eventually prevailed) against Tim Ball (the Plaintiff) in a lawsuit:The Defendants state that the Plaintiff never held a reputation in the scientific community as a noted climatologist and authority on global warming.
The Plaintiff is viewed as a paid promoter of the agenda of the oil and gas industry rather than as a practicing scientist.
http://www.desmogblog.com/sites/beta...%20Defence.pdf(Page 12, Section 50)
Tim Ball is also one of the perpetrators of the Global Cooling myth with statements such as: Yes, it warmed from 1680 up to 1940, but since 1940 its been cooling down.http://www.fcpp.org/main/publication....php?PubID=864 Please refer to the Global Temperature chart near the top of this page to see what has really happened. Is Tim Ball willfully lying or is Tim Ball completely out of touch with reality? (Could both be true?)
Another Tim Ballism: But also, the majority of the scientists who are on the Kyoto and global warming bandwagon know nothing about the science.http://www.fcpp.org/main/publication....php?PubID=864
Please refer to the Recommended links for further research section below for links/references about scientists who are on the global warming bandwagon.
And yet another Tim Ball delusion: Pre-industrial CO2 levels were about the same as today. http://www.canadafreepress.com/index.php/article/6855
Please note that current CO2 levels are above 385 parts per million - and then see where this would be plotted on the graph shown earlier in the The Historical Temperature Data vs. Carbon Dioxide & Methane section. (Hint: Nothing even close for over 650,000 years.)
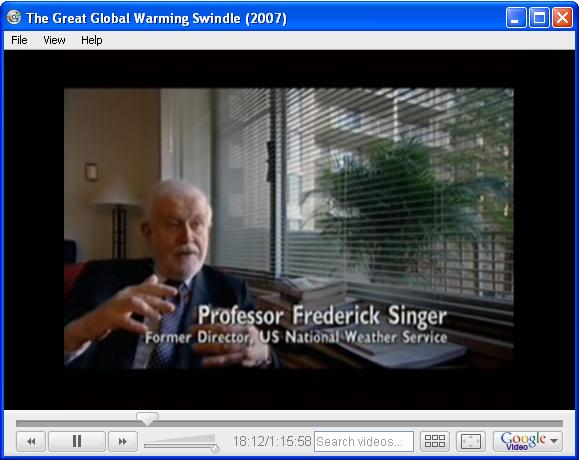
Similarly, the pseudo-documentary has a caption saying Fred Singer was the Former Director, US National Weather Service. In fact, Fred Singer was never a Former Director, US National Weather Service. These claims are not true, and are willful misrepresentations of the credentials of the participants in the movie. These are typical of the fraudulent claims that are present in the pseudo-documentary.
For example, at about 16 min. 24 sec. into the pseudo-documentary, Tim Ball asserts that the carbon dioxide content of the atmosphere is 0.054%. You would think that a real professor of climatology would know that the CO2 content of the atmosphere has only climbed above 0.038% in the last few years (http://www.esrl.noaa.gov/gmd/ccgg/trends/), and was consistently below 0.030% for at least 650,000 years before 1900.
Additional information at http://scienceblogs.com/stoat/2007/06/piers_corbyn.phpdescribes Piers Corbyn thusly:Piers Corbyn does not appear to have any academic standing, background, or contacts; he refuses to divulge his prediction techniques or methods to anyone for examination; and his actual prediction record is, shall we say, not exactly justified by the evidence, and I can say this from watching him.
Overall, I would place him in the category of "successful huckster" with the integrity of a sincere astrologer.
Note: A Google search using < Piers Corbyn charlatan > returns a significant number of hits.
The following information on Richard S. Lindzen was not included above but can be found at: http://www.alternet.org/envirohealth/50494/ and http://dieoff.org/page82.htm#1Lindzen, for his part, charges oil and coal interests $2,500 a day for his consulting services; his 1991 trip to testify before a Senate committee was paid for by Western Fuels, and a speech he wrote, entitled "Global Warming: the Origin and Nature of Alleged Scientific Consensus," was underwritten by OPEC. In 1991, Western Fuels spent an estimated $250,000 to produce and distribute a video entitled "The Greening of Planet Earth," which was shown frequently inside the Bush White House as well as within the governments of OPEC.
And as quoted at:http://www.pbs.org/wgbh/pages/frontl.../skeptics.htmlDr. Lindzen is a member of the Advisory Council of the Annapolis Center for Science Based Public Policy, which has received large amounts of funding from ExxonMobil and smaller amounts from Daimler Chrysler, according to a review Exxon's own financial documents and 990s from Daimler Chrysler's Foundation. Lindzen is a also been a contributor to the Cato Institute [see Organized Crime below], which has taken $90,000 from Exxon since 1998, according to the website Exxonsecrets.org and a review Exxon financial documents. He is also a contributor for the George C. Marshall Institute.
Organized Crime and the Pseudo-documentarys Expert, S. Fred Singer
 It appears that the pseudo-documentarys expert, Professor Fred Singer, has been a co-organizer (with Organized Crime) of pseudo-scientific organizations whose members consist of other scientists who were willing participants in a Propaganda for pay program. The purpose of these pseudo-scientific organizations was to provide anti-environmental/anti-consumerism reports. These pseudo-scientific organizations are actually fronts for large energy and tobacco companies that wanted reports by name scientists that would hide (via disinformation) the fact that carbon dioxide emissions are causing global warming (climate change). (Participation by tobacco companies was to hide the harmful effects of cigarette smoking.)
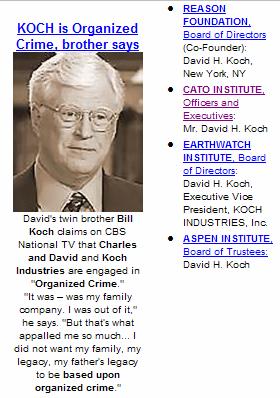
Currently, a Google search using < Fred Singer organized crime > returns over 1,000 hits. You will find multiple connections to other people in the above list including Patrick Michaels links with the Cato Institute (e. g.http://www.cato.org/people/michaels.html ). In turn, the Cato Institute is part of David Kochs alleged organized crime network. (Picture at right is fromhttp://www.ecosyn.us/adti/Koctopus_01.html, and it has a great deal more information.)
A couple of good starter links for further research would include:
http://h2-pv.us/adti/AdTI_Contents/AdTI_Contents.html
http://www.ecosyn.us/adti/Singer-Nightline.html
For other links, Google is your friend. For example: < Koch Industries global warming >
Complicity between Patrick Michaels, Koch, etc. and the IREA
(Intermountain Rural Electric Association)
The following quotes are from page 2 of a July 17, 2006 IREA newsletter.
Signed by Stanley R. Lewandowski, Jr. (General Manager)
http://www.realclimate.org/irea_letterJul06.pdfIn February of this year, IREA alone contributed $100,000 to Dr. Michaels. In addition, we have contacted all of the G & Ts in the United States and as of the writing of this letter, we have obtained additional contributions and pledges for Dr. Michaels group.
Koch Industries is working with other large corporations, including AEP and the Southern Company, on possibly financing a film that would counteract An Inconvenient Truth. Koch has also decided to finance a coalition that very likely will be administered through the National Association of Manufacturers.
There is no confirmation regarding a connection between the above financing a film and Durkins TGGWS, but - if you could follow the money ?
More on Fred Singer from the New York Times
The following quotes were originally in the New York Times on April 26, 1998 and are archived at http://www.stopesso.com/coverage/00000077.php It seems that not only is Fred Singer a member of the Denial Industry, he helped to organize it. (Note: The reference to argue against the Administration was in Clintons administration. The Bush administration has tried to reinforce this anti-climate agenda.)
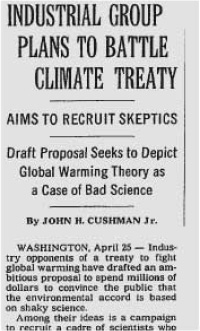
INDUSTRIAL GROUP PLANS TO BATTLE CLIMATE TREATY
By JOHN H. CUSHMAN Jr. (New York Times) 1140 words
April 26, 1998, Sunday
WASHINGTON, April 25 -- Industry opponents of a treaty to fight global warming have drafted an ambitious proposal to spend millions of dollars to convince the public that the environmental accord is based on shaky science. Among their ideas is a campaign to recruit a cadre of scientists who share the industry's views of climate science and to train them in public relations so they can help convince journalists, politicians and the public that the risk of global warming is too uncertain to justify controls on greenhouse gases like carbon dioxide that trap the sun's heat near Earth.
The draft plan calls for recruiting scientists to argue against the Administration, and suggests that they include ''individuals who do not have a long history of visibility and/or participation in the climate change debate.'' But among the plan's advocates are groups already linked to the best-known critics of global-warming science. They include the Science and Environment Policy Project, founded by Fred Singer, a physicist noted for opposing the mainstream view of climate science.
This Industrial Group financing campaign to manufacture doubt about Global Warming has been continuing ever since. The front groups that receive the corporate money are presented as think tanks and research organizations, but what is in back of them is strictly paid propaganda financed by large corporations. Jeff Masters has an in depth analysis that provides additional details. Please see The Manufactured Doubt industry and the hacked email controversy athttp://www.wunderground.com/blog/Jef...?entrynum=1389
Does Global Warming Exist?
As to whether global warming exists, we only have to look at the earths canary birds - the glaciers. For example, see http://www.gi.alaska.edu/ScienceForum/ASF17/1731.html.
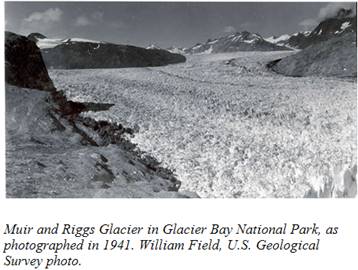
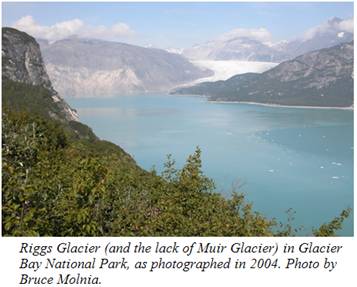
The (historic) Muir Glacier is an extreme example, but there are many other examples. (If you have Google Earth on your computer, go to 59.012N, 136.163W and look slightly west of due north to generate a view similar to the views above.)
USGS scientist Bruce Molnia: more than 99 percent of Americas thousands of large glaciers have long documented records of an overall shrinkage as climate warmshttp://www.usgs.gov/newsroom/article.asp?ID=2277
The above is a Print Screen image from:http://www.worldviewofglobalwarming..../glaciers.html
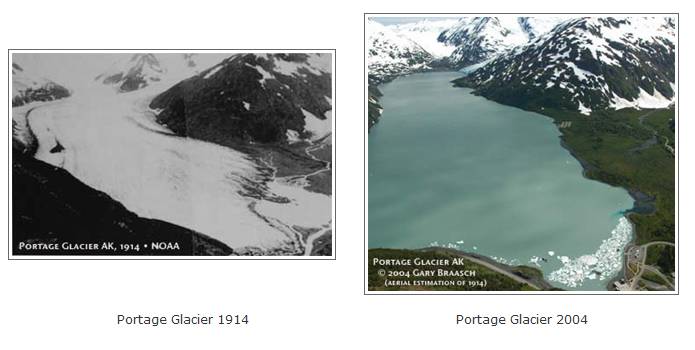
Portage Glacier, Alaska
Portage Glacier is one of the standard tourist stops on Alaskan tours. Its about 49 miles southeast of Anchorage. You can optionally take a boat trip up to the base of the glacier.
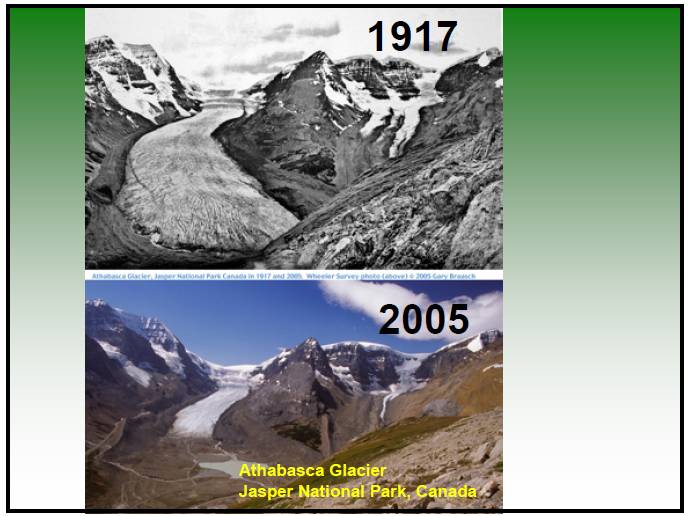
The twin photos above are from:
http://www.engr.colostate.edu/~pierr...09%20hand3.pdf
They show what the Athabasca Glacier looked like back in 1917 vs. what was left of it in 2005. The glacier on the right side of the photos is the Dome Glacier. Both glaciers have shrunk noticeably in the time interval.
The Athabasca Glacier is the most visited glacier in North America. It is just off the Icefields Parkway in Jasper National Park, Alberta, Canada.http://en.wikipedia.org/wiki/Icefields_Parkway
In the past 125 years, the Athabasca Glacier has lost half of its volume and receded more than 1.5 kilometers (0.93 miles). The recession rate has accelerated since 1980.
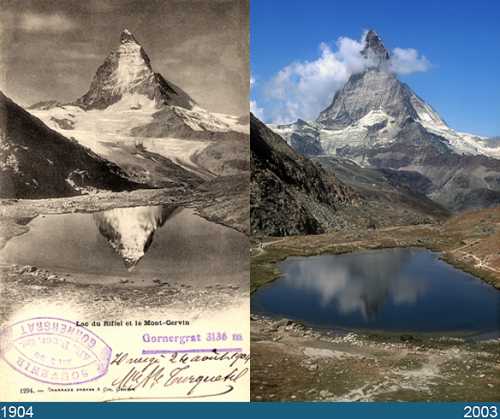
The picture pairs above and below are courtesy ofhttp://www.gletscherarchiv.de/en/fot...letscher_liste
Do you recognize the impressive mountain in the background? Hint: Its near Zermatt. Switzerland.
The left picture is a copy of an old post card. The Furgg Glacier can be seen snaking around the front of the tall pyramidal mountain. Also, part of the glacier covers the lower slopes of the tall mountain.
By 2003 there isnt much left of the glacier. The very dark area below and slightly to the right of the mountain is the shadow from a 500-foot high cliff below a ridge. One hundred years ago, the glacier was thick enough to completely cover the ridge. If you have Google Earth on your computer, you can see trimlines and moraines that mark the former extent of the glacier. To find the area formerly covered by the Furgg Glacier, just look about 4 miles southwest of Zermatt Switzerland - or alternately, about 2 miles ENE of (and a tad down from) the summit of the Matterhorn.
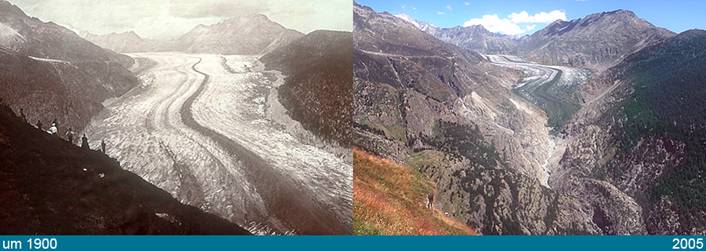
The twin pictures above show two views of the Great Aletsch Glacier in the Swiss Alps. The Aletsch is the longest glacier in the Alps and may have the dubious distinction of being one of the last to disappear completely. There are multiple other then and now pictures of glaciers that can be seen at:http://www.gletscherarchiv.de/en/fot...letscher_liste
The above picture is a Print Screen Image fromhttp://www.aip.org/history/climate/xglaciers.htm
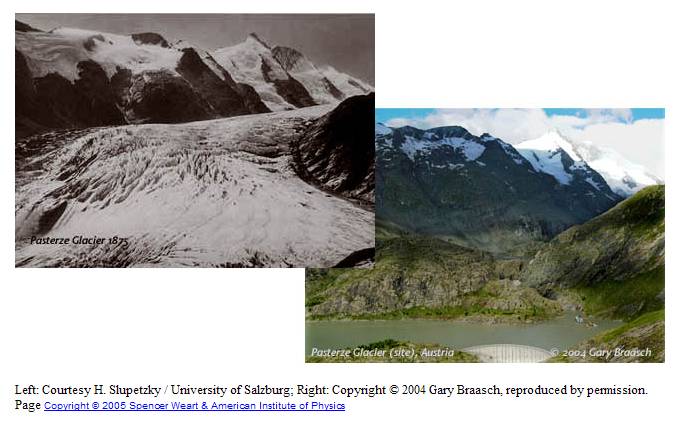
The Pasterze Glacier is the longest glacier in Austria. The two pictures above show what it looked like in 1875 vs. the same view in 2004. In 1875 the glacier was over one-half mile wide and over 500 feet thick. (Measured via Google Earth) Guess what Global Warming/Climate Change has done to this glacier?

Not only are glaciers melting world-wide, the melting rate is accelerating.
World Glacier Monitoring Service: The average mass balance of the glaciers with available long-term observation series around the world continues to decrease, with tentative figures indicating a further thickness reduction of 0.5 metres water equivalent (m w.e.) during the hydrological year 2007/08.
http://www.geo.unizh.ch/wgms/mbb/sum08.html
http://www.geo.unizh.ch/wgms/mbb/mbb..._2008_fig2.pdf
Wikipedia has an extensive article documenting glacial retreat around the world including several then and now photographs. As documented in the article, glacial retreat has accelerated since 1990. http://en.wikipedia.org/wiki/Retreat...ers_since_1850
A Google image search using << glacier global warming >> returns hundreds of thousands of photographs/images showing glacial shrinkage due to Global Warming.
http://images.google.com/images?hl=e...=&aqi=&start=0
Can Insignificant Humans Alter the Earths Vast Atmosphere?
Lets do a little simple math. The surface area of the Earth is 197,000,000 square miles.http://www.britannica.com/ebi/article-199816
The Worlds population is 6,602,224,175 (July 2007 est.)https://www.cia.gov/library/publicat...k/geos/xx.html
This yields 33.51+ people per square mile. (Includes oceans) Our surface area allotment per person is a square a little over 912 feet by 912 feet, and our per capita atmospheric allotment is the air above this square.
If you left your car running in a 25 ft. x 25 ft. closed garage, it would take only a few minutes to get into trouble. It takes longer if your garage is 912 ft. x 912 ft. x 5 miles high, but again, the results are cumulative. (If you represent the earths atmosphere by a column of air with uniform density at standard temperature and pressure, the column would be slightly under 5 miles high. In reality, the atmospheres average temperature is slightly less than standard temperature which would produce a slight further reduction in this height.)
Why the Pseudo-Documentary was produced
There are many people in the world whose attitude is: Dont bother me with the facts - Ive already made up my mind. Typically, these people hold emotion-based opinions, and dont want to learn that their opinions are no better than urban legends.
Supermarket tabloids appeal to people that fall into the above category. These same people also blindly believe pseudo-documentaries such as The Great Global Warming Swindle. These people who have a need to believe arent interested in the facts. But they are quite willing to believe a fraudulent pseudo-documentary that supports Dont bother me with the facts - Ive already made up my mind. The Martin Durkins of the world get paid to generate pseudo-documentaries to service this market.
The Producer of the Pseudo-Documentary (Martin Durkin) has a past record of turning out other allegedly biased pseudo-documentaries that appeal to the Dont bother me with the facts - Ive already made up my mind. audience. The following is a quote from Wikipedia http://en.wikipedia.org/wiki/Martin_Durkin_(television_director)
Martin Durkin is a television producer and director, most notably of television documentaries for Channel 4 in Britain. He has caused consistent controversy over the alleged bias found in many of his documentaries. He is understood to have once been closely involved with the Revolutionary Communist Party and its later offshoots Living Marxism and Spiked, a magazine and associated political network which promotes libertarian views, and is highly critical of environmentalism.
Evidence that Martin Durkin has a past record of sleazebag productions
It appears that this is not the only time that Martin Durkin has used cut-and-paste, out of context clips from legitimate scientists to misrepresent the original meaning. He has used this same tactic in some of his previous pseudo-documentaries. The following quote is from: http://www.gmwatch.org/profile1.asp?PrId=39 (and there is a lot more at this web page)Two scientists critical of genetic engineering who were invited to contribute to the programme, Dr Arpad Pusztai and Dr Mae-Wan Ho, both subsequently complained that they were misled about the content and were not given a chance to reply to attacks on their positions (Pusztai's comments). Dr Ho said , 'I feel completely betrayed and misled. They did not tell me it was going to be an attack on my position.'
Past complicity by Channel 4 (Channel Four)
It appears that Channel 4 is a co-conspirator with Martin Durkin regarding other previous pseudo-documentaries. The following is a quote from:http://www.gmwatch.org/profile1.asp?PrId=39Channel Four had to broadcast a prime-time apology after Against Nature drew the wrath of the Independent Television Commission which ruled, 'Comparison of the unedited and edited transcripts confirmed that the editing of the interviews with [the environmentalists who contributed] had indeed distorted or misrepresented their known views. It was also found that the production company had misled them... as to the format, subject matter and purpose of these programs.' (See CHANNEL 4 SAVAGED BY TELEVISION WATCHDOG )
Durkin had intentionally sought out questionable sources and data
The above quote is an excerpt from a long post at
http://reasic.wordpress.com/2007/03/...m-documentary/
that in turn quotes from the UK newpaper The Independent. The entire post illustrates the distortions that Mr. Durkin used to try to promote his own agenda. Single indentions sections are quotes from the Reasic article while double indentions are quotes from The Independent. The URL for the original article in The Independent is:http://news.independent.co.uk/enviro...cle2355956.eceMartin Durkins Scientific Reply to Dr. Armand Leroi
Channel 4 Distances Itself From Documentary March 14th, 2007
UK newpaper The Independent has conducted an investigation into the claims made and data used in Martin Durkins latest documentary. As they reported today, theyve found that the charts and data used in the film were not entirely accurate:The Great Global Warming Swindle, was based on graphs that were distorted, mislabelled or just plain wrong. The graphs were nevertheless used to attack the credibility and honesty of climate scientists.
A graph central to the programmes thesis, purporting to show variations in global temperatures over the past century, claimed to show that global warming was not linked with industrial emissions of carbon dioxide. Yet the graph was not what it seemed.
Other graphs used out-of-date information or data that was shown some years ago to be wrong. Yet the programme makers claimed the graphs demonstrated that orthodox climate science was a conspiratorial lie foisted on the public.
After a little poking around, the reporter found that Durkin had intentionally sought out questionable sources and data, then misrepresented them as being from NASA:The programme-makers labelled the source of the world temperature data as Nasa but when we inquired about where we could find this information, we received an email through Wag TVs <acronym title="Google Page Ranking"><acronym title="Google Page Ranking">PR</acronym></acronym> consultant saying that the graph was drawn from a 1998 diagram published in an obscure journal called Medical Sentinel. The authors of the paper are well-known climate sceptics who were funded by the Oregon Institute of Science and Medicine and the George C Marshall Institute, a right-wing Washington think-tank.
However, there are no diagrams in the paper that accurately compare with the C4 graph. The nearest comparison is a diagram of terrestrial northern hemisphere temperatures - which refers only to data gathered by weather stations in the top one third of the globe.
However, further inquiries revealed that the C4 graph was based on a diagram in another paper produced as part of a petition project by the same group of climate sceptics. This diagram was itself based on long out-of-date information on terrestrial temperatures compiled by Nasa scientists.
However, crucially, the axis along the bottom of the graph has been distorted in the C4 version of the graph, which made it look like the information was up-to-date when in fact the data ended in the early 1980s.
Mr Durkin admitted that his graphics team had extended the time axis along the bottom of the graph to the year 2000. There was a fluff there, he said.
When questioned about these discrepancies, Channel 4 distanced itself from the project:Channel 4 yesterday distanced itself from the programme, referring this newspapers inquiries to a public relations consultant working on behalf of Wag TV, the production company behind the documentary.
Many have already pointed out the distortions in the film. Its nice to see that this is reaching mainstream sources.
When Dr Armand Leroi from Imperial College London wrote to Martin Durkin to complain about the distorted science presented in the program, this was Martin Durkins scientific reply:-----Original Message----- From: Martin Durkin
[mailto:mdurkin@wagtv.com] Sent: 09 March 2007 09:53 To: Armand
Leroi; lbolch@channel4.co.uk Cc: simonsingh@msn.com;
ben@badscience.net Subject: RE: The Global Warming Swindle
Isnt nice to know that Channel 4s journalism standards include and defend:
You're a big daft cock
Youre a big daft cock
And from The Times On Line
http://www.timesonline.co.uk/tol/new...cle1517515.eceMartin Durkin, the executive producer of The Great Global Warming Swindle, responded to the concerns of Dr Armand Leroi, from Imperial College, and Simon Singh, the respected scientific author, by telling them to go and f*** yourself. (Use a Google search for multiple links that omit the ***)
Mr Durkin replied nine minutes later: The BBC is now a force for bigotry and intolerance . . .
Why have we not heard this in the hours and hours of shit programming on global warming shoved down our throats by the BBC?
Never mind an irresponsible bit of film-making. Go and f*** yourself.
Recommended links for further research
The following organizations provide evidence that:
1) Global Warming / Climate Change is real.
2) Human activities are by far the largest causative agent.
3) Global Warming / Climate Change is a continuing, ongoing phenomenon.
NASA
http://climate.nasa.gov/warmingworld/
http://www.nasa.gov/worldbook/global...worldbook.html
http://earthobservatory.nasa.gov/Fea...lWarmingQandA/
http://data.giss.nasa.gov/gistemp/graphs/Fig.A2.lrg.gif (The graph)
National Oceanic and Atmospheric Administration
National Climatic Data Center
http://www.ncdc.noaa.gov/oa/climate/globalwarming.html
World Meteorological Organization (WMO)
http://www.wmo.ch/pages/about/wmo50/...warming_e.html
American Meteorological Society
http://www.ametsoc.org/policy/2007climatechange.html
Warming of the climate system now is unequivocal The dominant cause of the warming since the 1950s is human activities.http://www.ametsoc.org/policy/2012climatechange.html
National Center for Atmospheric Research
How do we know Earth is warming now?
http://www.ncar.ucar.edu/research/climate/now.php
Earth System Research Laboratory - Global Monitoring Division
Climate Forcing
http://www.esrl.noaa.gov/gmd/about/climate.html
University Corporation for Atmospheric Research
http://www.ucar.edu/research/climate/warming.jsp
Jet Propulsion Laboratory - California Institute of Technology
Global Climate Change How do we know?
http://climate.jpl.nasa.gov/evidence/
American Geophysical Union (world's largest scientific society of Earth and space scientists)
Human Impacts on Climate
http://www.agu.org/sci_soc/policy/cl..._position.html
American Association for the Advancement of Science
The scientific evidence is clear: global climate change caused by human activities is occurring now
http://www.aaas.org/news/press_room/..._statement.pdf
http://www.aaas.org/news/press_room/climate_change/
U. S. National Academy of Sciences
Climate change is real
http://www.nationalacademies.org/onpi/06072005.pdf
National Science Foundation
Global Warming Greatest in Past Decade
http://www.nsf.gov/news/news_summ.jsp?cntn_id=112206
U. S. Geological Survey
Glacier and Landscape Change in Response to Changing Climate
http://www.usgs.gov/global_change/glaciers/default.asp
Time lapse video: Glacier Erasure: South Cascade Glacier in a Changing Climate
http://wa.water.usgs.gov/projects/glacier/video.html
Geological Society of America
The Geological Society of America (GSA) concurs . . . that global climate has warmed and that human activities (mainly greenhouse gas emissions) account for most of the warming since the middle 1900s.
http://www.geosociety.org/positions/position10.htm
National Snow and Ice Data Center - Global Glacier Recession
We live in a time of increasing greenhouse gas concentrations with an attendant warming of the climate.
http://nsidc.org/glims/glaciermelt/
United Nations Environment Programme/World Glacier Monitoring Service
Global Glacier Changes: facts and figures
There is mounting evidence that climate change is triggering a shrinking and thinning of many glaciers world-wide
http://www.grid.unep.ch/glaciers/ (Introduction and links to a 26 MB WGMS report)
The United States Energy Information Administration
Greenhouse Gases, Climate Change, and Energy
http://www.eia.doe.gov/bookshelf/bro...e/Chapter1.htm
Massachusetts Institute of Technology
Report: Human activity fuels global warming
http://web.mit.edu/newsoffice/2007/climate.html
Also: The new projections are . . . the median surface warming in 2091 to 2100 is 5.1°C
http://globalchange.mit.edu/pubs/abs...ication_id=990
California Institute of Technology
How We Know Global Warming is Real
The science behind human-induced climate change
http://www.gps.caltech.edu/~tapio/pa...eptic_2008.pdf
Stanford University
Global warming . . . is now well documented and accepted by scientists as fact.
http://solar-center.stanford.edu/sun...glob-warm.html
Columbia University
The Greenhouse Effect and Global Warming
With higher CO2 concentrations come expectations of a stronger greenhouse effect and therefore warmer global temperatures.
http://www.columbia.edu/~vjd1/greenhouse.htm
Atmospheric Sciences - University of Illinois - Champaign
Evidence continues to mount that human activities are altering the Earths climate on a global scale.
http://www.atmos.uiuc.edu/research/01climate.html
Woods Hole Oceanographic Institution
http://www.whoi.edu/main/topic/global-warming
Scripps Institution of Oceanography (University of California - San Diego)
http://scripps.ucsd.edu/img/climate_flyer.pdf
The UKs Met Office Hadley Centre
Climate change - the big picture
http://www.metoffice.gov.uk/corporat...ths/index.html
http://www.metoffice.gov.uk/climatechange/guide/
The UKs Royal Society
Climate change controversies: a simple guide
http://royalsociety.org/page.asp?id=6229
Intergovernmental Panel on Climate Change (Based in Switzerland)
Climate Change 2007: Synthesis Report
http://www.ipcc.ch/pdf/assessment-re...r4_syr_spm.pdf
Japan Meteorological Agency
Global Warming Projection Vol.7
http://ds.data.jma.go.jp/tcc/tcc/pro...7/index-e.html
The Australian Meteorological and Oceanographic Society
Our climate has changed substantially. Global climate change and global warming are real and observable.
http://www.amos.org.au/publications/...t/publications
Royal Society of New Zealand
The globe is warming because of increasing greenhouse gas emissions.
http://www.royalsociety.org.nz/Site/.../clim0708.aspx
National Geographic Magazine
http://environment.nationalgeographi...lobal-warming/
Scientific American Magazine
http://www.sciam.com/topic.cfm?id=gl...climate-change
Wikipedia
Scientific opinion on climate change is that the Earth's climate system is unequivocally warming and it is more than 90% certain that humans are causing it through activities that increase concentrations of greenhouse gases in the atmosphere
http://en.wikipedia.org/wiki/Scienti...climate_change (100+ references with links)
http://en.wikipedia.org/wiki/Global_warming
http://en.wikipedia.org/wiki/Climate_change
http://en.wikipedia.org/wiki/Greenhouse_effect
http://en.wikipedia.org/wiki/Greenhouse_gas
The Real Data as Researched by Legitimate Scientists
 INTERGOVERNMENTAL PANEL ON CLIMATE CHANGE
Climate Change 2007: The Physical Science Basis
http://www.ipcc.ch/SPM2feb07.pdf
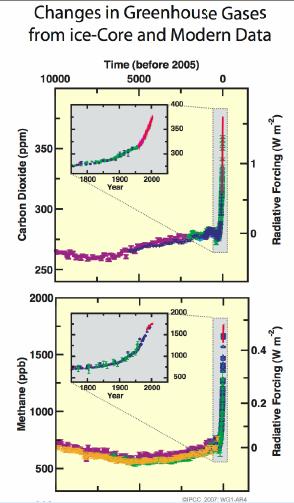
The charts to the right show the real forcing effect resulting from Carbon Dioxide and Methane as shown in the above IPCC report. The unit of measure is Watts per Sq. Meter. One watt is about the strength of a small Christmas tree light. It takes decades for ocean water several miles deep to warm up at this rate, but the rate is cumulative, and this same lag means that forcing over the last few decades will be contributing to future warming for decades into the future.Global atmospheric concentrations of carbon dioxide, methane and nitrous oxide have increased markedly as a result of human activities since 1750 and now far exceed pre-industrial values determined from ice cores spanning many thousands of years (see Figure SPM-1). The global increases in carbon dioxide concentration are due primarily to fossil fuel use and land-use change, while those of methane and nitrous oxide are primarily due to agriculture.
The primary source of the increased atmospheric concentration of carbon dioxide since the pre-industrial period results from fossil fuel use, with land use change providing another significant but smaller contribution.
Warming of the climate system is unequivocal, as is now evident from observations of increases in global average air and ocean temperatures, widespread melting of snow and ice, and rising global average sea level.
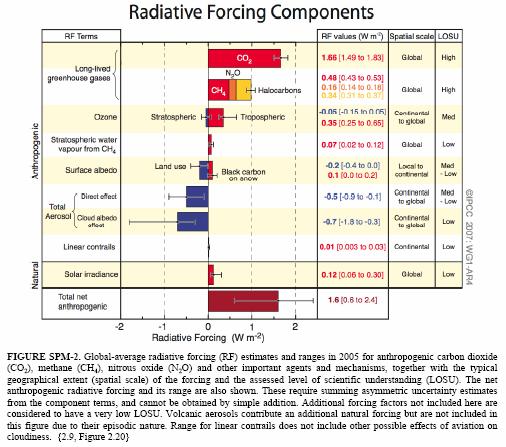
The chart to the right (from the same report) shows the relative magnitude of the components involved in global warming. Carbon dioxide is of course dominant. Sulfur dioxide and condensation nuclei (haze, smoke, etc.) cause increased cloudiness that partially offsets forcing due to greenhouse gases. There has been a minor contribution from increased solar radiation, but this is less than 10% of the man-made components.
For further research about the real data, please see:
NOAAs Earth System Research Laboratory - Global Monitoring Division
http://www.esrl.noaa.gov/gmd/ (Includes up to date Mauna Loa CO2 readings)
NASAs Goddard Institute for Space Studies - Forcings in GISS Model
http://data.giss.nasa.gov/modelforce/
Illustrates Changes in climate "forcings" or factors that have contributed to climate change since 1750.
National Climate Data Center at NOAA.
http://www.ncdc.noaa.gov/paleo/globalwarming/index.html
University Corporation for Atmospheric Research UCAR/NCAR
http://www.ucar.edu/research/climate/warming.jsp
Legitimate Scientists are the Bad Guys - Martin Durkin
And what does Martin Durkin have to say about real scientists?
The following quote is from Life Style Extra, UK News, 'Global Warming Is Lies' Claims Documentary
http://www.lse.co.uk/ShowStory.asp?s...ms_documentaryControversial director Martin Durkin said: "You can see the problems with the science of global warming, but people just don't believe you - it's taken 10 years to get this commissioned.
"I think it will go down in history as the first chapter in a new era of the relationship between scientists and society. Legitimate scientists - people with qualifications - are the bad guys.
Is Martin Durkin trying to get us to believe that only movie directors understand science, and legitimate scientists dont? Is Martin Durkin actually telling us that the real reason he made the movie was to promote his personal war against legitimate scientists? (And collect a few bucks from the Dont bother me with the facts - Ive already made up my mind. audience.)
Note: Run a Google search using the above phrase for other sources to confirm that this is what Martin Durkin actually said.
A link to this web page by MITs Professor Carl Wunsch
(The aforementioned scientist who was swindled by Martin Durkin)
1) Go to: http://ocean.mit.edu/~cwunsch/CHANNEL4.html
2) Click on: Discussion of some of the science and other distortion in the "Swindle" (Bill Butler)
A link from the Australian Broadcasting Corporations The Science Show
1) Go to: http://www.abc.net.au/rn/scienceshow...07/1966036.htm
2) Click on: Durango Bill's Debunking the Deniers of Global Warming
(Listed under Further Information)
A link from The Dilbert Blog that generated over 10,000 page hits
http://dilbertblog.typepad.com/the_d..._warming_.html
(Just before the Comments section)[Update: It took about ten minutes for reader Chris Graham to post this link debunking the video "The Great Global Warming Swindle.":http://www.durangobill.com/Swindle_Swindle.html. Obviously I am unqualified to judge either the video or the debunking to it, but the last thing I read always seems the most persuasive.]
Complaint to Ofcom
The following is a copy of an online complaint that the author has filed with the UKs Office of Communications (Ofcom) http://www.ofcom.org.uk/complain/From: (Address & Tel. omitted for this posting)
To: Complaints at the UKs Office of Communications (Ofcom)http://www.ofcom.org.uk/complain/
Dear Sirs:
While I am not a citizen of the United Kingdom and did not see the original Channel 4 broadcast of The Great Global Warming Swindle, the program has been widely posted on the Internet via YouTube.com (where I first saw it), Google Videos, and subsequently via several dozen pirate postings.
I understand that there have been multiple formal complaints filed in regard to the broadcast. I am not familiar with the specific UK broadcasting regulations that have been violated, but I would like to file a complaint that the claimed data and observational assertions made in the program are in fact false and fictitious. In any scientific investigation you are allowed to interpret real data/observations, but if you falsify the source data you are willfully misleading other people into potentially believing these falsified observations. In turn erroneous governmental/industry policy decisions may be based on this false data, and public acceptance of these false observations may lead to decisions that are misguided and wasteful of taxpayer funds.
I have outlined some of my observations on the misleading/fraudulent data regarding the pseudo-documentary at a web page titled: The Great Global Warming Swindle is itself a Fraud and a Swindlehttp://www.durangobill.com/Swindle_Swindle.html
In an effort to try to stop the worldwide dissemination (via television in other countries, the Internet, DVD sales, etc.) of what I regard as fraudulent/dishonest material, I ask that you force Channel 4 (and any other directly supervised parties) to publicly apologize for presenting the program and force them to state that the presentation was not based on factual data.
Sincerely,
Bill Butler
Correspondence with the Australian Broadcasting Corporation (ABC)
A representative of the ABC contacted me (by E-mail) before their July 12, 2007 scheduled broadcast of The Swindle. All information/inquiries from them will remain confidential as per their request, but the following is part of my July 7, 2007 reply.
My opinion.
The Australian Broadcasting Corporation is doing a major disservice by broadcasting the film. You are fanning the flames of emotionalism in pursuit of ratings. There are major questions that should be addressed by policy makers throughout the world. These would include:
Can anything meaningful be done to mitigate "Global Warming" (Climate Change)?
If something meaningful can be done, what will it cost? (And you better have a firm grip on something when you address this problem.)
The one sure guarantee regarding the presentation of the movie is that policy makers will not be able to make rational decisions. Anything that they might do will instead be based on emotional opinions of the voters who have elected them. I fear the eventual outcome will be that a great deal of money will be wasted on "pseudo-solutions" that will accomplish - nothing.
Sincerely,
Bill Butler
Why did the Australian Broadcasting Corporation show The Swindle?
In any Ace detective story, if you want to find the culprit, rule Number One is to either 1) Follow the money or 2) Follow the politics. In this case rule number 2) seems applicable as it seems the United States is not the only country in the world where high ranking government officials declare themselves to be disciples whose mission is to redefine science.
There have been multiple stories in the Australian press that the ABCs Board of Directors forced the movie to be shown despite the advice of the ABCs science expert, Robyn Williams. In turn, the ABCs Board of Directors is appointed by the Governor-General. The information shown below about four (a majority) of the boards seven directors can be found at http://www.answers.com/topic/austral...ng-corporation (unless otherwise indicated), and provides some insight as to the politics involved in the boards decision to show the film.
Maurice Newman (ABC chairperson): Maurice Newman is the current Chairperson of the Australian Broadcasting Corporation, as well as chair of the board of the Australian Stock Exchange. He is a close personal friend of Australian Prime Minister John Howard.
Janet Albrechtsen: Albrechtsen's political views are strongly conservative, and she has supported the Howard government, the foreign policies of the Bush administration, the war on terror and the invasion of Iraq.
Ron Brunton: Brunton's appointment to the ABC Board by the Australian Government of John Howard created controversy given his ideological partisanship.[1] However, it continues that government's attempt to move the ABC culture to a political position more amenable to its own.
Keith Windschuttle: (From Australian Broadcasting Corporation adopts new bias rules http://www.wsws.org/articles/2006/nov2006/abc-n04.shtml ) Prominent in the audience was ABC board member Janet Albrechtsen, a right-wing Murdoch columnist who reportedly initiated the policy shift. An awful lot of work has gone into drawing up these guidelines, she proudly told reporters. Another extreme right-wing Howard appointee to the board, Keith Windschuttle, also praised the guidelines.
The Quality and Reliability of Martin Durkins Research
As noted earlier, Martin Durkin keeps changing the content of the movie as one after another of his misrepresentations are revealed. The picture below (fromhttp://www.abc.net.au/science/featur...armingswindle/) shows a new graph that was added to the July 12, 2007 Australian version of Martin Durkins pseudo-documentary.
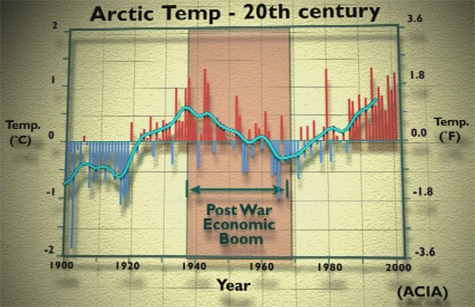 See if you can find any problems with the quality and reliability of Martin Durkins research.
Hint 1) The attack on Pearl Harbor was December 7, 1941. (All dates are local time)
Hint 2) Germany surrendered on May 7, 1945.
Hint 3) Japan formally surrendered on September 2, 1945.
Hint 4) The earliest that the Post War Economic Boom could begin would have to be sometime after September 2, 1945.
Hint 5) When did the Post War Economic Boom begin according to Martin Durkins Research?
And this is from someone who claims: Martin Durkin studied ancient and medieval history at University College Londonhttp://www.greatglobalwarmingswindle...in_durkin.html
Question: Why is there no reference to a degree?
As for the ACIA source cited in the graph, the real Arctic Climate Impact Assessment includes a 140-page report titled Impacts of a Warming Arctic and a much larger 1020-page, Scientific Report Arctic Climate Impact Assessment book. Both have conclusions that are radically different than Martin Durkins assertions. For example, from page 4 of ACIAs Policy Document:
1. The Arctic climate is now warming rapidly and much larger changes are projected.
http://www.acia.uaf.edu
The picture to the right is from page 35 in ACIAs Arctic Climate: Past and Present report at:http://www.acia.uaf.edu/PDFs/ACIA_Sc...Ch02_Final.pdf
It appears to be the source for Durkins graph. Once again take a close look at the right hand portion of the graphs where Durkin has omitted the warmest year on record (original source uses data through 2003) as well as the steep rise in the smoothed curve.
(And a thank you goes to Wolfgang Wieser for finding this source.)
Stay tuned for future misrepresentations by Martin Durkin. . .
Also please see:Global Warming Denial Liars
http://www.durangobill.com/GwdLiars/GwdLiarsIndex.html
The Global Warming Stopped in 1998 Lie
http://www.durangobill.com/GwdLiars/...pedIn1998.html
Christopher Monckton A vociferous Global Warming Deniers Liar
http://www.durangobill.com/GwdLiars/...rMonckton.html
The Oregon Institute of Science and Medicine
(Its actually a farm in very rural Oregon)
http://www.durangobill.com/GwdLiars/...dMedicine.html
Roger Cohens proposed $5,000 bet
A (retired) Exxon Mobil executives attempt to use money to promote his personal agenda.
http://www.durangobill.com/RogerCohen.html
Note: The author (Bill Butler) of this web page is a magna cum laude, Computer Science graduate of Brown University. A brief bio can be found at message # 8http://groups.yahoo.com/group/CSAtrium/
(CSAtrium is a Yahoo group for the alums of Brown Universitys Computer Science Department and Computer Engineering graduates.)
Return to Durango Bills home page
Web page generated via KompoZer
http://www.durangobill.com/Swindle_Swindle.htmlNO AMNESTY
Don't reward the criminal actions of millions of illegal aliens by giving them citizenship.
Sign in and post comments here.
Please support our fight against illegal immigration by joining ALIPAC's email alerts here https://eepurl.com/cktGTn
-
01-15-2014, 07:19 PM #2Senior Member
- Join Date
- Aug 2008
- Location
- PARADISE (San Diego)
- Posts
- 99,038
NO AMNESTY
Don't reward the criminal actions of millions of illegal aliens by giving them citizenship.
Sign in and post comments here.
Please support our fight against illegal immigration by joining ALIPAC's email alerts here https://eepurl.com/cktGTn


 Reply With Quote

Mike Lindell Floats Amnesty for Illegal Aliens: Im a Person of...
07-22-2026, 10:23 PM in illegal immigration News Stories & Reports