

Results 11 to 20 of 23
Thread Information
Users Browsing this Thread
There are currently 1 users browsing this thread. (0 members and 1 guests)
 LinkBack URL
 About LinkBacks
Threaded View


-
11-24-2012, 02:49 PM #1Senior Member


- Join Date
- May 2007
- Location
- South West Florida (Behind friendly lines but still in Occupied Territory)
- Posts
- 117,696
Data Suggests Climate Entering 30 Year Cooling Period, Perhaps Longer
20 November 2012
Data Suggests Climate Entering 30 Year Cooling Period, Perhaps LongerOngoing sea temperature readings suggest that global heat content has stabilised over the past 15 years -- despite an 8.5% rise in atmospheric CO2 levels. Ongoing observations are diverging significantly from James Hansen's IPCC model projections, as seen below. Some observers of climate data are expecting the Earth to pass through at least a 30 year climate cooling period.

The apparent "decoupling" of global heat from atmospheric CO2 concentrations -- with the clear divergence of observed temperatures from projected temperatures -- provides mounting evidence for falsification of IPCC climate models.
Here is an excerpt from an article by Dr. Norman Page, which uses empirical data to contradict IPCC climate model-based projections (via WUWT):
1. Check the Temperature Trends and Data.
Because of the Urban Heat Island effect ,the built in local variability of the NH land data and the thermal inertia of the oceans, Sea Surface Temperatures are the best measure of global temperature trends. These show that the global warming trend ended in about 2003. THERE HAS NOW BEEN NO NET WARMING SINCE 1997 -15 YEARS WITH CO2 RISING 8.5% WITH NO GLOBAL TEMPERATURE INCREASE. SINCE 2003 THE TREND IS NEGATIVE.
To check the past years go to
ftp://ftp.ncdc.noaa.gov/pub/data/ano...1-2000mean.dat
and for monthly updates go to.
ftp://ftp.ncdc.noaa.gov/pub/data/anomalies/monthly.ocean.90S.90N.df_1901-2000mean.dat
The 2012 average NCDC SST anomaly thru Sept was .4438 versus the 1997 annual anomaly of .4575.
The peak anomaly was .5207 in 2003.
An excellent site for reviewing all the basic temperature data is climate4you welcome
2. Check the current phase of the Pacific Decadal Oscillation.
Here is a plot and suggested projection based on the Hadley SST3 from Tallbloke.
Fig 2

(See: The Carbon Flame War: Final Comment « Tallbloke's Talkshop) He says I have put together a simple model which replicates sea surface temperature (which drives global lower troposphere temperature and surface temperatures a few months later). The correlation between my model and the SST is R^2=0.874 from 1876 FOR MONTHLY DATA. The model is shown with predictions to 2050 (blue) along with the HADsst3 (red).
I included Fig 2 because an approximate 60 year cycle is obvious by inspection and this coincides well with the 30 year +/- positive (warm) and 30year +/ negative (cold) phases of the Pacific Decadal Oscillation. Figure 2 shows warming from about 1910 - 1940-45 , cooling from then to about 1975 -.warming to about 2003-5 and cooling since then. Total warming during the 20th century was about 0.8 degrees C. For a complete discussion and review of the data relating the PDO to the other oceanic cycles and temperatures see
http://myweb.wwu.edu/dbunny/pdfs/ale...cillations.pdf
For latest PDO data see http://jisao.washington.edu/pdo/PDO.latest
IT IS CLEAR THAT WE ARE IN THE EARLY STAGES OF A THIRTY YEAR NEGATIVE (COOLING ) PDO CYCLE.
Fig3 ( from climate4you welcome)
3. Check Solar Activity where are we at?
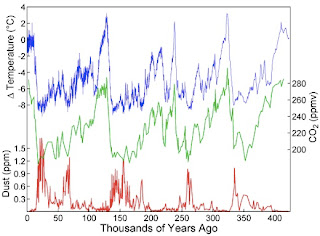
The major ice age climate cycles are controlled by the sun earth orbital eccentricity,and the earths obliquity and precession. These cycles are approximately 100,000, 41,000 and 21000 years in length respectively and are well documented in the ice core and geological record. It is useful to keep in mind that the warmest temperatures in the current interglacial occurred about 7500+/- years ago and the GENERAL TREND IS NOW A COOLING TOWARDS THE NEXT ICE AGE.
Fig 4 http://colli239.fts.educ.msu.edu/199...1/vostok-1999/
These long term cycles are modulated by quasi cyclic trends in solar activity which may be decadal ,centennial or millennial in length.Of particular interest in deciding where we are with regard to the solar cycles is the approximately 1000 +/- year cycle which produced succesively the Roman Warm Period, the Dark Ages,the Medieval Warm Period, the Little Ice Age and the recent 20th century warming.
Fig 5 (From Climate was HOTTER in Roman, medieval times than now: Study ⢠The Register )

The red line shows the continuing cooling trend from the Holocene optimum and the 1000yr +/- solar cycle is clearly seen.
NOTE A REASONABLE CASE CAN BE MADE THAT THE WARMING PEAKS OF A 60 YEAR PDO CYCLE AND THE 1000 YEAR SOLAR CYCLE COINCIDED AT 2000 +/- AND WE ARE LIKELY ON THE COOLING SLOPE OF BOTH.
The clearest empirical measure of solar activity is the solar magnetic field strength. On an empirical basis Livingston and Penn have shown that the decline in solar magnetic field strength suggests that sunspots could disappear by about 2015 signalling THE START OF A NEW MAUNDER MINIMUM WITH SIGNIFICANT COOLING.
For a semi-empirical estimate of the possible cooling if a Maunder Minimum does develop see http://pubs.giss.nasa.gov/docs/2001/...ell_etal_1.pdf
__WUWT Near Future Cooling
Of course no one has a perfect lock on predicting the future of climate or anything else. But there is more than sufficient doubt concerning IPCC model projections to block any large scale implementation of massive redistribution of funds -- ultimately in the $trillions of dollars -- based upon IPCC model output. Particularly since the IPCC and its sister UN organisations would be among the main beneficiaries of this extorted largesse.
In the eyes of faux environmental greens, there is no doubt that humans are bringing doom to the planet -- one way of the other. If they are forced to give up carbon hysteria doom, they will simply reach down into the muck of their own doom-seeking minds and scoop up another imaginary flavour of doom with which to terrify the dumbed down masses.
Best to keep on your toes with this lot.
Labels: Climate Grifters, climate models
Al Fin: Data Suggests Climate Entering 30 Year Cooling Period, Perhaps LongerJoin our efforts to Secure America's Borders and End Illegal Immigration by Joining ALIPAC's E-Mail Alerts network (CLICK HERE)


 Reply With Quote

BRUTAL! Bill Melugin Throws Down Against Jim Jordan and GOP...
05-10-2024, 04:20 PM in illegal immigration News Stories & Reports