

Results 1 to 1 of 1
Thread Information
Users Browsing this Thread
There are currently 1 users browsing this thread. (0 members and 1 guests)
 LinkBack URL
 About LinkBacks
-
06-19-2012, 08:50 PM #1Senior Member


- Join Date
- May 2007
- Location
- South West Florida (Behind friendly lines but still in Occupied Territory)
- Posts
- 117,696
Mike Shedlock: 100% of U.S. Jobs Added Since 2010 Have Been Self-Employment
Friday, June 15, 2012 2:44 AM
100% of U.S. Jobs Added Since 2010 Have Been Self-Employment, Contractor, or Other Jobs Without Unemployment Insurance Benefits
Here are some charts from Reader Tim Wallace that help explain my report a few days ago that 23% of Small Business Owners (Approximately 6.21 million) Report "No Pay for a Year"; New Zealand, Singapore, US, Best Places to Start and Run a Business
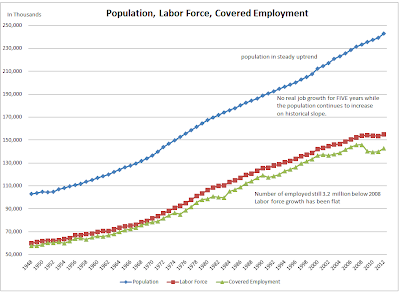
The first chart below shows actual employment of covered workers compared to the civilian population and labor force. Covered employees are those eligible for unemployment benefits (working or not). Some are currently collecting those benefits.
In the following charts, "covered employment" or "net employment" refers to those with benefits and currently working.
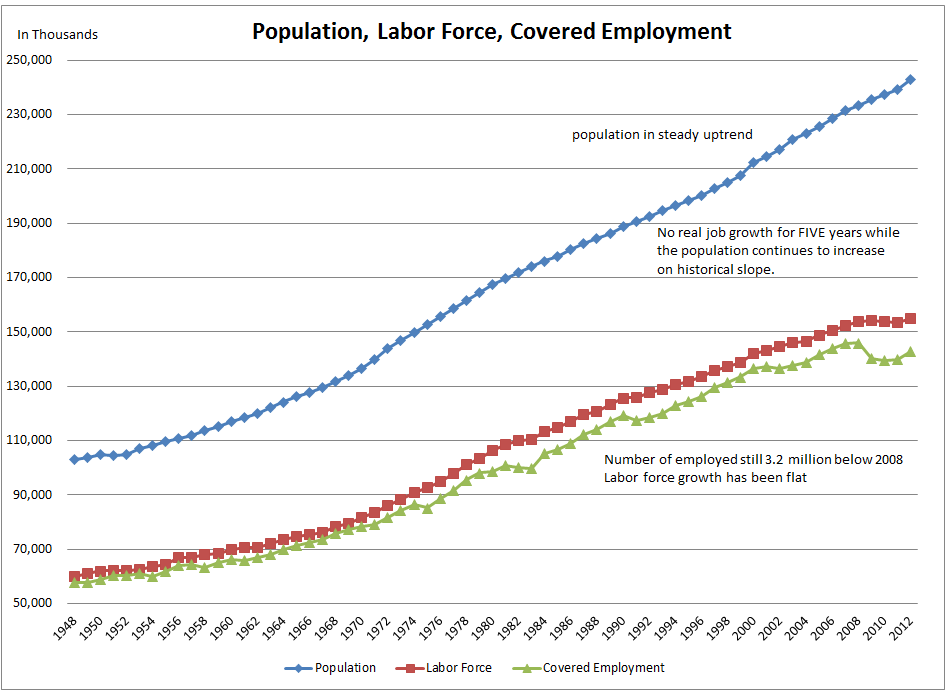
Population, Labor Force, Covered Employment
click on any chart for sharper image
Self-employed workers and contractors are not eligible for unemployment benefits even though they have to contribute to state unemployment insurance schemes. It believe it is government-sponsored fraud to have to pay unemployment insurance when there is no chance of ever collecting it.
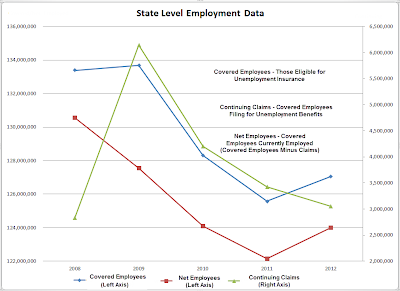
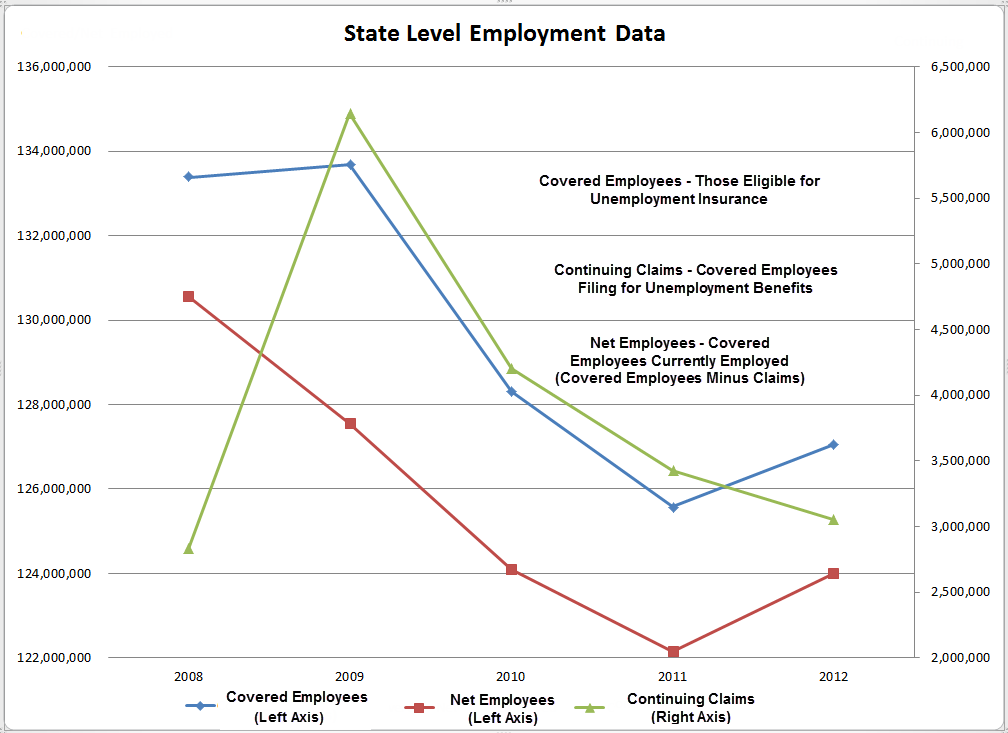
The next chart shows state level employment data. Net covered employees (those currently with a job covered with unemployment benefits) was calculated by subtracting continuing unemployment claims from the pool of all covered workers.
Covered Employees, Net Covered Employees, Continuing Claims
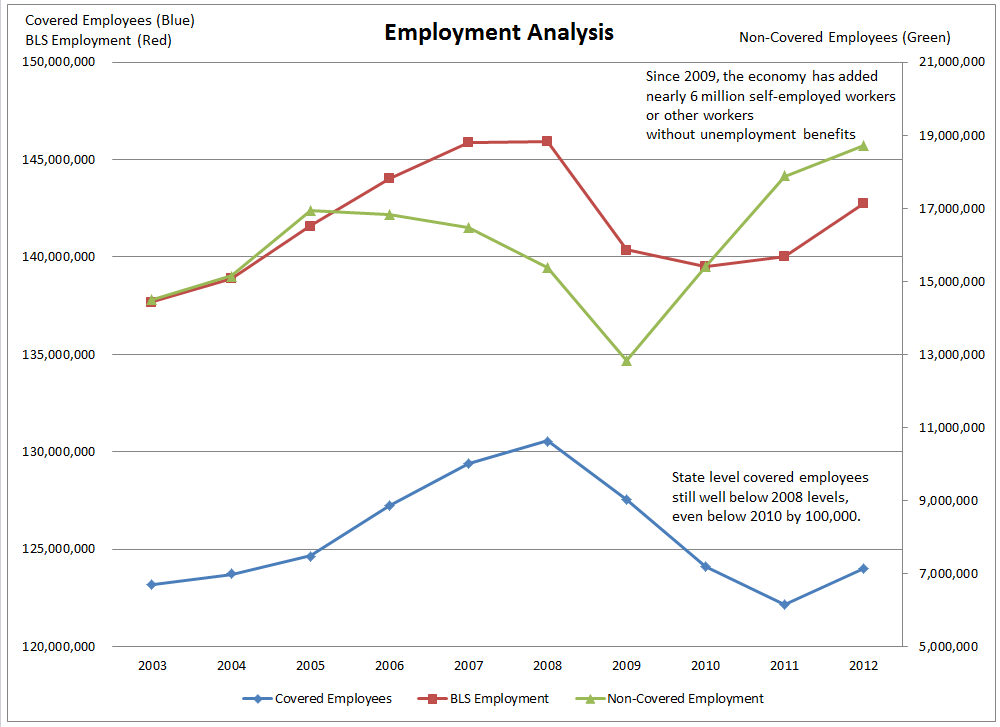
The next chart compares BLS employment numbers to net covered employees (those actually working).
BLS Employment , Covered Employment, Non-Covered Employment
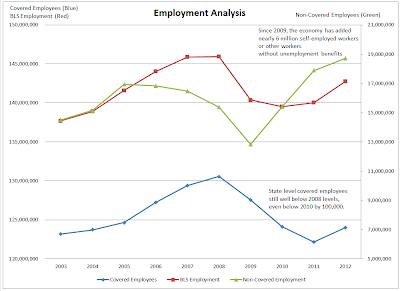
Notice the widening gap between covered employment and employment as reported by the BLS. In 2008 and again in 2010 the difference between BLS employment and Covered Employment as noted by the green line (right axis) was about 15 million.
This month the difference is nearly 19 million. The table below shows the precise numbers.
Year Covered Employees BLS Employment Non-Covered Employment 2003 123,193,833 137,687,000 14,493,167 2004 123,717,669 138,867,000 15,149,331 2005 124,663,546 141,591,000 16,927,454 2006 127,217,409 144,041,000 16,823,591 2007 129,399,094 145,864,000 16,464,906 2008 130,553,967 145,927,000 15,373,033 2009 127,539,427 140,363,000 12,823,573 2010 124,096,266 139,497,000 15,400,734 2011 122,146,266 140,028,000 17,881,734 2012 123,996,700 142,727,000 18,730,300
Since 2010, the economy has added 3.23 million jobs according to the BLS. Of those 3.23 million jobs, 3.33 million (slightly greater than 100%) have been self-employment, contractor, family-business jobs, or other jobs with insufficient wages and therefore ineligible to collect unemployment insurance.
Since 2009 the numbers look much worse. In that timeframe the economy added 2.36 million jobs according to the BLS. Of those 2.36 million jobs, 5.91 million (250%) were self-employment or jobs otherwise not covered by unemployment insurance benefits.
Unemployment insurance benefits vary state to state. Bouncing around between temporary jobs may also make one ineligible, especially if there are lengthy lapses between jobs.
Inquiring minds may be interested in Unemployment Insurance Eligibility FAQs for Connecticut. You need to consult rules for your state.
Non-Covered Employment Percentage Hits All-Time High
Year "Non-Covered Employment" 2003 10.5% 2004 10.9% 2005 12.0% 2006 11.7% 2007 11.3% 2008 10.5% 2009 9.1% 2010 11.0% 2011 12.8% 2012 13.1%
Non-Covered Employment in the above table means any job that does not provide unemployment insurance benefits.
Notes About Unemployment (From the Link at Top)
Bear in mind, that making money or receiving a paycheck is irrelevant to the BLS when they compute the unemployment rate. If you work as little as 1 hour, whether you collect a paycheck or not, you are considered employed.See article for additional stats on working with no pay as well as a county-by-country comparison as to the best places to start and run a business.
In addition to the 6.21 million business owners with no paycheck, factor in those selling trinkets on EBay out of desperation and collecting a few dimes in the process.
Also factor in all those starting multi-level marketing schemes and calling it a business. How many get sucked into that losing proposition every year? Yet, to the BLS, it's a job if you worked any hours.
The ease of starting a business in the US is a great thing. Unfortunately, making money in a small business startup is not so easy.
Historic trends suggest half of small businesses will fail within 5 years, and I highly suspect future trends will be much worse.
Also note that Doing Business offers economic rankings of 183 countries on numerous categories including starting a business, ease of doing a business, getting construction permits, etc.
Conclusion
6.21 million working without pay in conjunction with the reported boom in self-employment looks rather believable in light of excellent charts from reader Tim Wallace.
Factor in disability fraud (see 2.2 Million Go On Disability Since Mid-2010; Fraud Explains Falling Unemployment Rate; Will Higher Disability Taxes Fix the Problem?) and the realistic conclusion is the unemployment rate is much higher than reported while the alleged recovery is much weaker than reported.
Mike "Mish" Shedlock
Mish's Global Economic Trend Analysis
http://globaleconomicanalysis.blogspot.com/2012/06/100-of-jobs-added-since-2010-have-been.html
Join our efforts to Secure America's Borders and End Illegal Immigration by Joining ALIPAC's E-Mail Alerts network (CLICK HERE)


 Reply With Quote

Arizona GOP pushing tough, new border policies, but faces strong...
05-05-2024, 10:24 AM in illegal immigration News Stories & Reports