

Results 1 to 1 of 1
Thread Information
Users Browsing this Thread
There are currently 1 users browsing this thread. (0 members and 1 guests)
 LinkBack URL
 About LinkBacks
-
08-30-2010, 09:58 PM #1Senior Member


- Join Date
- May 2007
- Location
- South West Florida (Behind friendly lines but still in Occupied Territory)
- Posts
- 117,696
Major Banks Oppose Honest Reporting To Hide Huge Loan Losses
All Major Banks Oppose Honest Reporting To Hide Huge Loan Losses
Economics / Credit Crisis 2010 Aug 30, 2010 - 01:41 PM
By: Mike_Shedlock
Reader "Henry" has a question on the loan loss provision chart I posted in Former Fed Vice Chairman vs. Mish: Is the Fed Out of Ammo? http://globaleconomicanalysis.blogspot. ... s-fed.html
Henry writes ...
Hello Mish,
Thanks for writing and sharing your wonderful column. It has been very informative and educational.
Could you please help us mere mortals decipher the ALLL/LLRNPT chart in a follow up post?
I have difficulty reconciling the units, and I suspect I'm not the only one. Exactly what does that chart depict?
Thanks.
Henry
From my previous post ...
Assets at Banks whose ALLL Exceeds their Nonperforming Loans
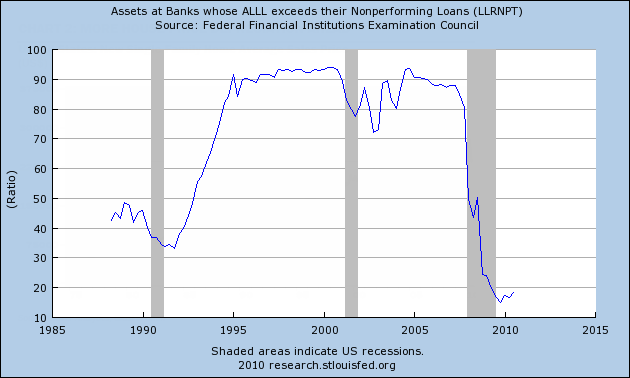
The ALLL is a bankâs best estimate of the amount it will not be able to collect on its loans and leases based on current information and events. To fund the ALLL, the bank takes a periodic charge against earnings. Such a charge is called a provision for loan and lease losses.
One look at the above chart in light of an economy headed back into recession and a housing market already back in the toilet should be enough to convince anyone that banks already have insufficient loan loss provisions.
That is one of the reasons banks are reluctant to lend. Lack of creditworthy customers is a second. Quite frankly would be idiotic to force more lending in such an environment.
To further clarify, the chart depicts the ratio of loan loss provisions to nonperforming loans across the entire banking system (all banks). There are 33 ALLL charts by bank size and region http://research.stlouisfed.org/fred2/search/alll/1 for inquiring minds to consider. The above chart is the aggregate.
The implication what the chart suggests is that banks believe nonperforming loans are NOT a problem (or alternatively they are simply ignoring expected losses to goose earnings).
The implication what I suggest is banks earnings have been overstated. Why? Because provisions for loan losses are a hit to earnings. I believe losses are coming for which there are no provisions.
The chart depicts a form of "extend and pretend" and overvaluation of assets on bank balance sheets. The Fed and the accounting board ignore this happening (encourage is probably a better word), hoping the problem will get better. With more foreclosures and bankruptcies on the horizon, I suggest it won't.
Magnitude of the Problem
The above analysis is only in percentage terms. Let's see if we can figure out in dollar terms how big the problem is. A few more charts that will help do just that.
Nonperforming Total Loan Percentage
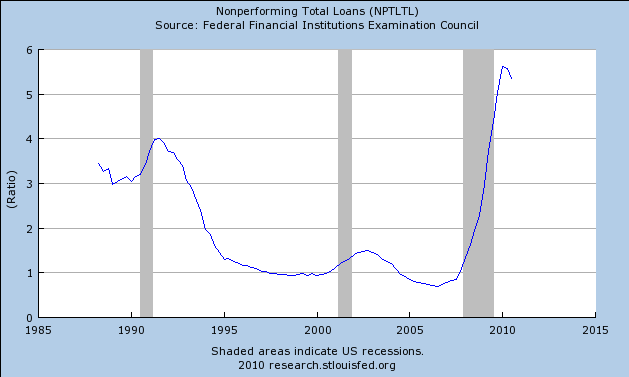
The above chart shows that 5.5% of loans are non-performing.
Total Loans and Leases
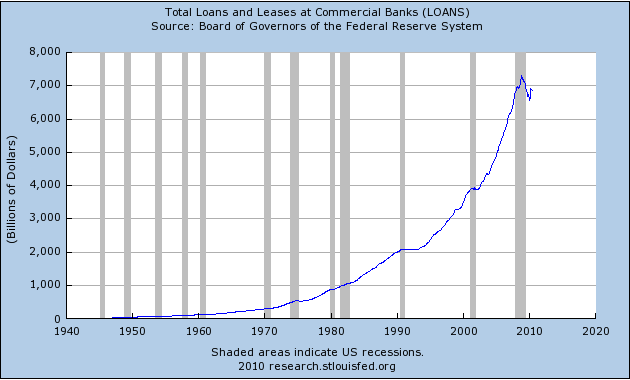
The above chart shows there are $7 trillion in total loans and leases. Of that 5.5% is nonperforming. Thus there are $385 billion of "admitted" nonperforming loans.
At the start of the recession, the first chart shows that banks had made a loan loss allowance for about 90% of non-performing loans. Now the figure is under 20%.
We are still not there yet, and this is where it gets fuzzy. Not all losses will be 100%, Some might be 10% others 80%. I cannot quantify the losses, I can just state there is a huge problem with insufficient loan loss provisions.
Charts Understate the Problem
The above charts understate the problem because there are hundreds of billions of dollars in nonperforming bank assets held off bank balance sheets.
We can add still more to the problem because of absurd mark-to-market valuations and the Fed and FDIC playing games with what constitutes a "nonperforming loan".
Banks Oppose Rule Changes
Inquiring minds note Wells Fargo âStronglyâJoin our efforts to Secure America's Borders and End Illegal Immigration by Joining ALIPAC's E-Mail Alerts network (CLICK HERE)


 Reply With Quote

Illegal immigration is costing American hospitals billions of...
04-27-2024, 07:55 PM in General Discussion