

Results 1 to 1 of 1
Thread Information
Users Browsing this Thread
There are currently 1 users browsing this thread. (0 members and 1 guests)
 LinkBack URL
 About LinkBacks
-
03-28-2010, 04:07 PM #1Senior Member


- Join Date
- May 2007
- Location
- South West Florida (Behind friendly lines but still in Occupied Territory)
- Posts
- 117,696
Stock Market Sentiment Indicate Investor Nirvana New Paradig
Stock Market Sentiment Indicates Investor Nirvana And New Paradigm
Stock-Markets / Stocks Bear Market
Mar 28, 2010 - 06:14 AM
By: Guy_Lerner
The sentiment indicators would suggest that this is not investing nirvana. While prices can certainly go higher, the lack of buying power should be obvious. Who is left to buy if everyone is all in? But judging by the emails I receive, most market participants believe that this is a new paradigm, where the Fed is engineering a new prosperity founded on gains in the market. Investing nirvana? I think not. This market environment is more like a high wire act. A new paradigm? Every era is new, but fear and greed never go away. I have yet to convince myself that "this time will be different".
Once again, from the Department of Broken Records....
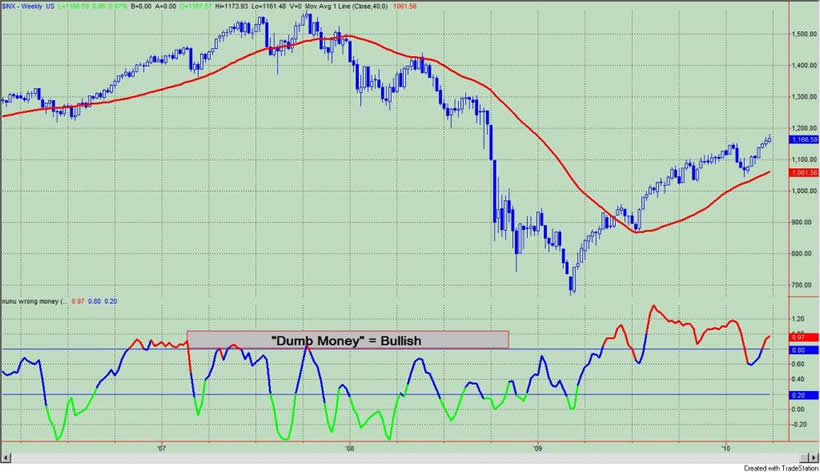
The "Dumb Money" indicator, which is shown in figure 1, looks for extremes in the data from 4 different groups of investors who historically have been wrong on the market: 1) Investor Intelligence; 2) Market Vane; 3) American Association of Individual Investors; and 4) the put call ratio. The "Dumb Money" indicator is bullish to an extreme degree.
Figure 1. "Dumb Money" Indicator/ weekly
The "Smart Money" indicator is shown in figure 2. The "smart money indicator is a composite of the following data: 1) public to specialist short ratio; 2) specialist short to total short ratio; 3) SP100 option traders. The Smart Money indicator is neutral/ bearish.
Figure 2. "Smart Money" Indicator/ weekly
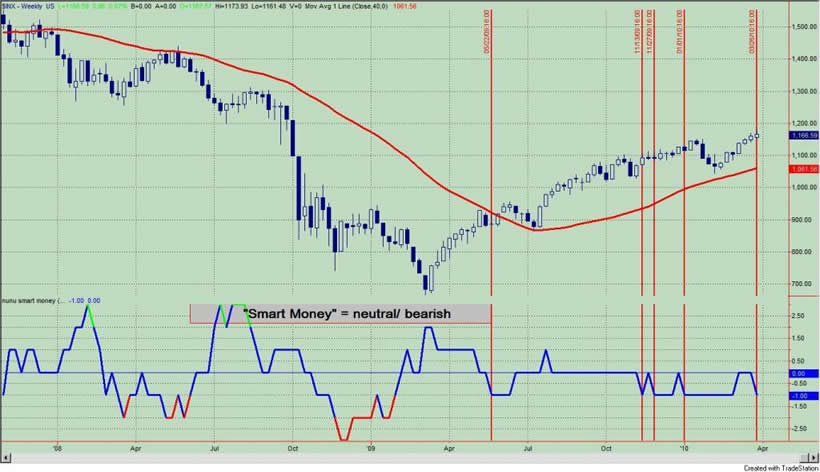
Figure 3 is a weekly chart of the S&P500 with the InsiderScore "entire market" value in the lower panel. From the InsiderScore weekly report we get the following: 1) "Our Weekly Score for the Entire Market edged higher as trading volumes lightened with the closure of trading windows as we enter earnings season. Overall a sell bias remains in place, following two consecutive weeks of multi-year lows."; 2) "we continue to see higher than normal levels of cluster selling".
Figure 3. InsiderScore Entire Market/ weekly
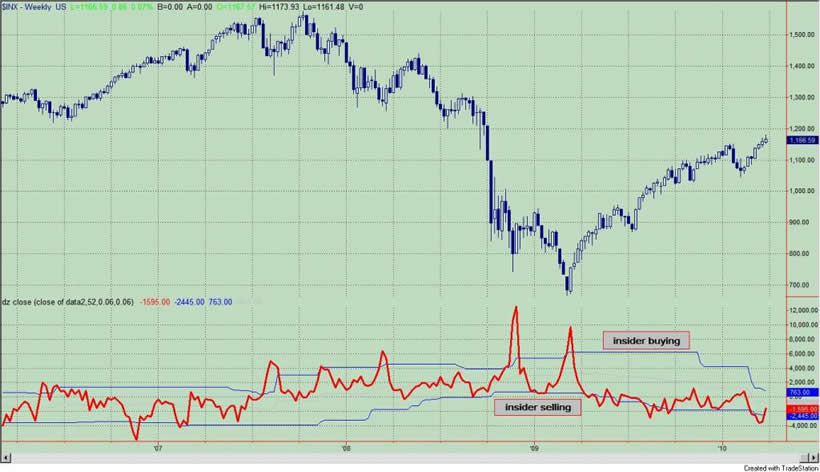
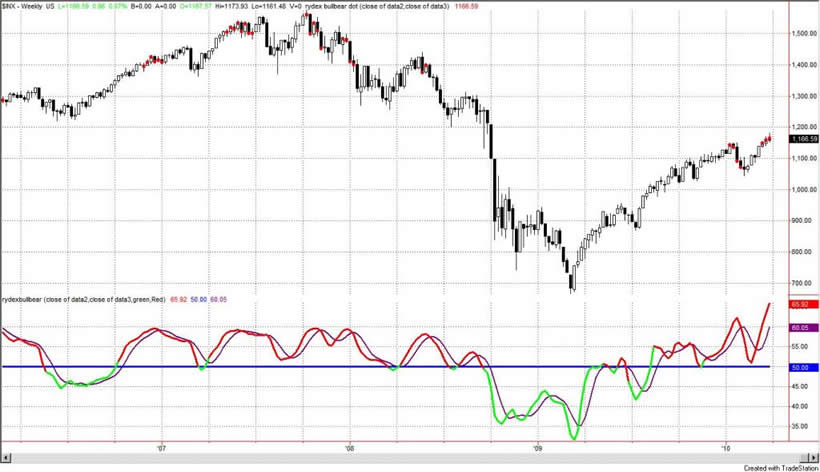
Figure 4 is a weekly chart of the S&P500. The indicator in the lower panel measures all the assets in the Rydex bullish oriented equity funds divided by the sum of assets in the bullish oriented equity funds plus the assets in the bearish oriented equity funds. When the indicator is green, the value is low and there is fear in the market; this is where market bottoms are forged. When the indicator is red, there is complacency in the market. There are too many bulls and this is when market advances stall.
Currently, the value of the indicator is 65.92%. Values greater than 58% (arbitrarily chosen) are associated with market tops, and the red dots over the price bars indicate such. The value can go higher, mind you, as there was a 66% reading in 2005. During that time when the indicator hit 58% the S&P500 was at 1184; 8 weeks later the indicator hit 66% and the S&P500 hit a high of 1217.
Shorter term Rydex measures continue to suggest excessive bullishness. This data, which has proved to be very actionable, is now available for a nominal yearly fee as Premium Content. This service should help you to improve your market timing!
Figure 4. Rydex Total Bull v. Total Bear/ weekly
By Guy Lerner
http://thetechnicaltakedotcom.blogspot.com/
Guy M. Lerner, MD is the founder of ARL Advisers, LLC and managing partner of ARL Investment Partners, L.P. Dr. Lerner utilizes a research driven approach to determine those factors which lead to sustainable moves in the markets. He has developed many proprietary tools and trading models in his quest to outperform. Over the past four years, Lerner has shared his innovative approach with the readers of RealMoney.com and TheStreet.com as a featured columnist. He has been a regular guest on the Money Man Radio Show, DEX-TV, routinely published in the some of the most widely-read financial publications and has been a marquee speaker at financial seminars around the world.
http://www.marketoracle.co.uk/Article18239.htmlJoin our efforts to Secure America's Borders and End Illegal Immigration by Joining ALIPAC's E-Mail Alerts network (CLICK HERE)


 Reply With Quote

JOE BIDEN WANTS TO BRING IN GAZA RESIDENTS AND GIVE THEM...
05-02-2024, 01:19 PM in Videos about Illegal Immigration, refugee programs, globalism, & socialism