

Results 1 to 4 of 4
Thread Information
Users Browsing this Thread
There are currently 1 users browsing this thread. (0 members and 1 guests)
 LinkBack URL
 About LinkBacks
-
07-03-2013, 06:01 AM #1Senior Member


- Join Date
- Feb 2005
- Posts
- 17,895
All Employment Growth in Last Decade Went to Immigrants
Center For Immigration Studies
By Steven A. Camarota, Karen Zeigler July 2013
Download a pdf of this Backgrounder
Foreign-born employment up 5.3 million since 2000,
US-born down 1.3 million
WASHINGTON, DC (July 3, 2013) A Center for Immigration Studies analysis of government data shows that from the first quarter of 2000 to the first quarter of 2013 the number of native-born Americans holding a job fell by 1.3 million, even though the overall size of the working-age (16 to 65) native population increased by 16.4 million. Over the same time period, the number of immigrants (legal and illegal) working increased 5.3 million. There has also been a broad decline in the percentage of natives holding a job, impacting almost every age, education level, and race.
The main justification for the large increases in permanent immigration and guest workers in the Schumer-Rubio bill (S.744) is that the nation does not have enough workers. But in the first quarter of this year nearly 59 million working-age natives were not working unemployed or entirely out of the labor force. This figure is little changed in the last three years and is almost 18 million larger than in 2000.
Given the employment situation, the dramatic increases in legal immigration in the Gang of Eight immigration bill seems grossly out of touch with the realities of the U.S. labor market, observed Steven Camarota, the reports co-author and the Centers Director of Research.
Among the reports findings (all figures compare first quarter employment): http://www.cis.org/immigrant-gains-native-losses-in-the-job-market-2000-to-2013
- · The overall size of the working-age (16 to 65) native-born population increased by 16.4 million from 2000 to 2013, yet the number of natives actually holding a job was 1.3 million lower in 2013 than 2000.
- · The total number of working-age immigrants (legal and illegal) increased 8.8 million, and the number working rose 5.3 million between 2000 and 2013.
- · Since the jobs recovery began in 2010, about half the employment growth has gone to immigrants. However the share of working-age (16 to 65) natives holding a job has remained virtually unchanged and as has the number not working nearly 59 million.
- · The decline in the share of natives working, also referred as the employment rate, began before the 2007 recession. In 2000 74 percent of working-age natives had a job, by 2007 at the peak of the last expansion just 71 percent worked, and in the first quarter of 2013 66 percent had a job.
- · The decline in employment rates for working-age natives has been nearly universal. The share of native teenagers as well as those in their 20s, 30s, 40s and 50s declined from 2000 to 2007 and from 2007 to 2013. The decline for those under 30 has been especially pronounced.
- · The employment rate declined for natives of virtually every education level from 2000 to 2007 and from 2007 to 2013.
- · The number of adult natives with no more than a high school education not working is up 4.9 million since 2000, it is up 6.8 million for those with some college and up 3.8 million for those with at least a bachelors degree.
- · The decline in work, which began before 2007, has impacted men and women; as well as blacks, Hispanics and whites. Native-born men, blacks, and Hispanics have been hit the hardest.
- · During the five years prior to 2013 (2008-2012), about 5.4 million new immigrants (legal and illegal) of all ages arrived in the United States. In the 5 years prior to 2007, about 6.6 million new immigrants arrived. Thus during the worst economic slowdown in the last 75 years, immigration fell by only 17 percent compared to the expansion of 2002-2006.
View the Senate bill, CIS Senate testimony and commentary at: http://cis.org/Border-Security-Economic-Opportunity-Immigration-Modernization-Act
Contact: Marguerite Telford
202-466-8185, mrt@cis.org
source: http://www.cis.org/immigrant-gains-n...22ea4-44707457Join our FIGHT AGAINST illegal immigration & to secure US borders by joining our E-mail Alerts at http://eepurl.com/cktGTn
-
07-03-2013, 06:08 AM #2Senior Member
- Join Date
- Feb 2005
- Posts
- 17,895
Immigrant Gains and Native Losses In the Job Market, 2000 to 2013
Steven A. Camarota, Karen Zeigler
By Steven A. Camarota, Karen Zeigler July 2013
Download a pdf of this Backgrounder
Steven A. Camarota is the Director of Research and Karen Zeigler is a demographer at the Center for Immigration Studies at the Center for Immigration Studies.

While jobs are always being created and lost, and the number of workers rises and falls with the economy, a new analysis of government data shows that all of the net gain in employment over the last 13 years has gone to immigrants (legal and illegal). From the first quarter of 2000 to the first quarter of 2013, the number of natives working actually fell by 1.3 million while the overall size of the working-age (16 to 65) native population increased by 16.4 million. Over the same time period, the number of immigrants working (legal and illegal) increased by 5.3 million.
In addition to the decline in the number of natives working, there has been a broad decline in the percentage holding a job that began before the 2007 recession. This decline has impacted natives of almost every age, race, gender, and education level. The total number of working-age (16 to 65) natives not working unemployed or out of the labor force entirely was nearly 59 million in the first quarter of this year, a figure that has changed little in the last three years and is nearly 18 million larger than in 2000.
Aside from the legalization provisions, one of the main justifications for the large increases in permanent immigration and guest workers in the Schumer-Rubio bill (S.744) is that the nation does not have enough workers. But the data do not support this conclusion. A second argument for the bill is that immigration always creates jobs for natives. But over the last 13 years nearly 16 million new immigrants arrived, 5.4 million since 2008. The last 13 years or even the last five years make clear that large-scale immigration can go hand in hand with weak job growth and persistently high rates of joblessness among the native-born.
Among the findings (all figures compare first quarter employment):
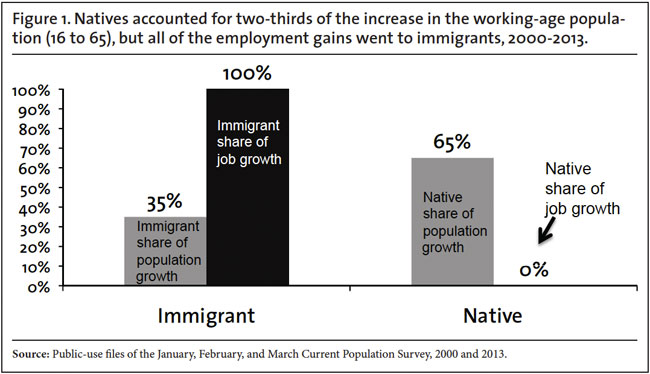
- Between the first quarter of 2000 and the first quarter of 2013, the native-born population accounted for two-thirds of overall growth in the working-age population (16 to 65), but none of the net growth in employment among the working-age has gone to natives.
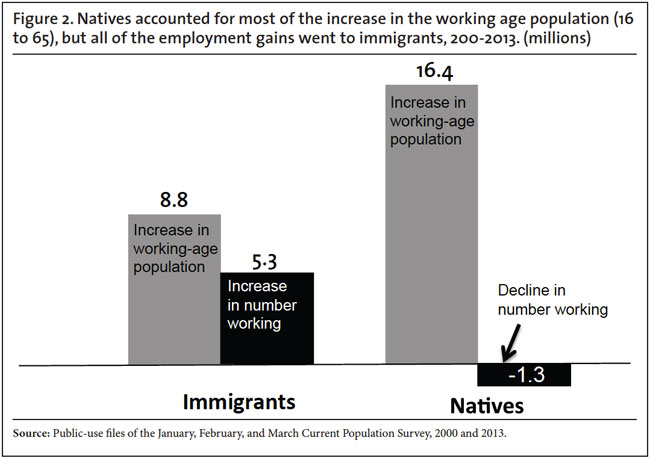
- The overall size of the working-age native-born population increased by 16.4 million from 2000 to 2013, yet the number of natives actually holding a job was 1.3 million lower in 2013 than 2000.
- The total number of working-age immigrants (legal and illegal) increased 8.8 million and the number working rose 5.3 million between 2000 and 2013.
- Even before the recession, when the economy was expanding (2000 to 2007), 60 percent of the net increase in employment among the working-age went to immigrants, even though they accounted for just 38 percent of population growth among the working-age population.
- Since the jobs recovery began in 2010, about half the employment growth has gone to immigrants. However the share of working-age natives holding a job has remained virtually unchanged since 2010 and the number of working-age natives without a job (nearly 59 million) has not budged.
- The decline in the share of natives working, also referred as the employment rate, began before the 2007 recession. Of working-age natives, 74 percent had a job in 2000; by 2007, at the peak of the last expansion, just 71 percent had a job, and in the first quarter of 2013, 66 percent had a job.
- The decline in employment rates for working-age natives has been nearly universal. The share of natives working has declined for teenagers and those in their 20s, 30s, 40s, and 50s from 2000 to 2007 and from 2007 to 2013. The decline has been especially pronounced for workers under age 30.
- Like age, there has been a decline in work for all educational categories. The employment rate for native high school dropouts, high school graduates, those with some college, and those with at least a bachelor's degree declined from 2000 to 2007 and from 2007 to 2013.
- The number of adult natives with no more than high school education not working is 4.9 million larger in 2013 than in 2000, the number with some college not working is up 6.8 million, and the number with at least a bachelor's degree not working is up 3.8 million.
- The decline in work, which began before the Great Recession, has impacted men and women as well as blacks, Hispanics, and whites. The fall in the share of working-age natives holding a job has been most pronounced for men, blacks, and Hispanics.
- During the five years prior to 2013 (2008-2012), about 5.4 million new immigrants (legal and illegal) of all ages arrived in the United States. In the five years prior to 2007, about 6.6 million new immigrants arrived. Thus, during the worst economic slowdown in the last 75 years, immigration fell by only 17 percent compared to the economic expansion from 2002 to 2006.
Discussion
This analysis examines employment trends for immigrants and natives using the "household survey", collected by the government. The survey, referred to as the Current Population Survey (CPS), is the nation's primary source of information on the labor market.1 This report follows the Census Bureau definition of immigrants, normally referred to as the foreign-born. Immigrants (the foreign-born) are those who are not U.S. citizens at birth and include naturalized citizens, Lawful Permanent Residents, temporary workers, foreign students, and illegal immigrants.
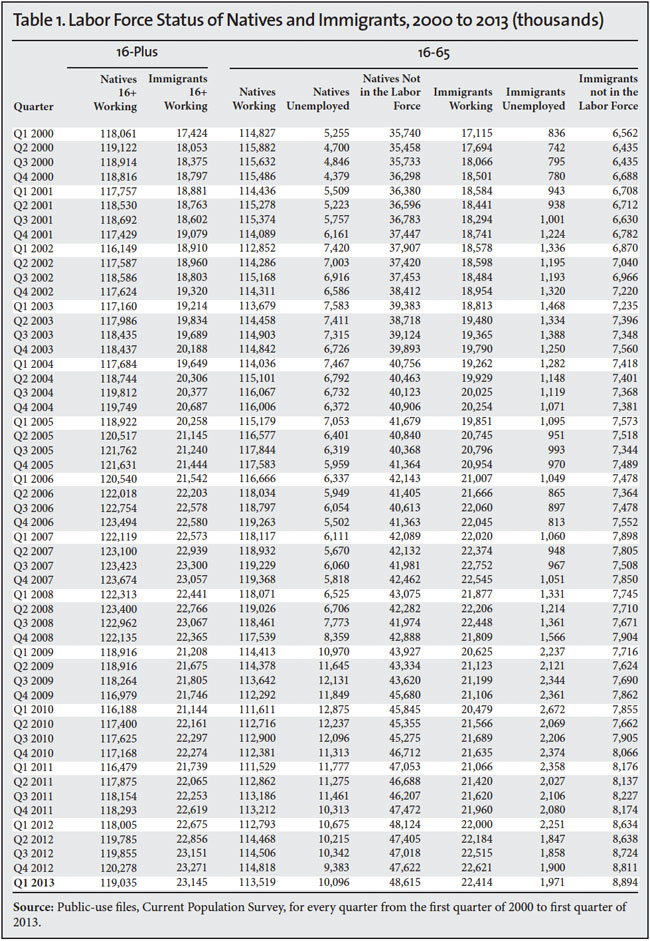
We concentrate on the first quarter of each year 2000 to 2013 because comparing the same quarter over time controls for seasonality and the first quarter of 2013 is the most recent quarterly data available. However, in Table 1 we report employment figures for immigrants and natives for every quarter 2000 to 2013. The same decline in work for natives exists regardless of the quarters compared.
Of course, many jobs are created and lost each month. Moreover, many workers change jobs each month. But over the last 13 years all of the net gain in the number of working-age (16 to 65) people employed has gone to immigrants as measured by the household survey. This is truly remarkable because natives accounted for two-thirds of population growth among the working-age population, but none of the net gain in employment.2 In short, there was a large increase in the number of potential native-born workers, but no net increase in the number of native-born workers under age 65 actually working.
Comparing the number of immigrants working (ages 16 to 65) in the first quarter of 2000 to the number working in the first quarter of 2013 shows an increase of 5.3 million. In contrast, the number of working-age (16 to 65) natives holding a job was 1.3 million fewer in the first quarter 2013 than in 2000, even though the number of working-age natives overall increased by 16.8 million in this time period. (See Figure 1 and Table 1.)
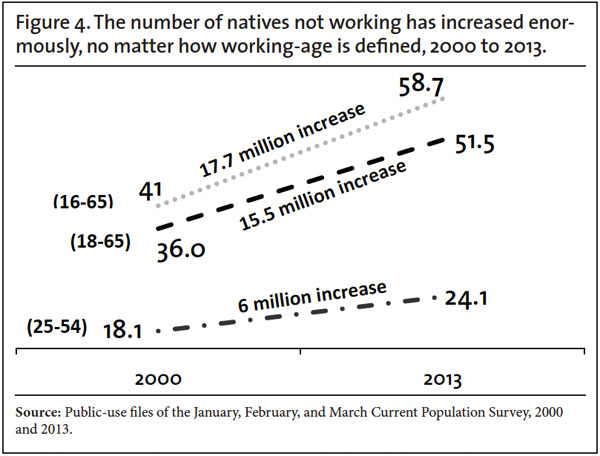
If we define working-age as 25 to 54, which is often seen by economists and demographers as the core of the work force, there has been a decline in the share of natives working from 82.4 percent in 2000 to 80.5 percent in 2007 to 76 percent in 2013. The number of natives 25 to 54 without a job increased by two million from 2000 to 2007, and increased another four million after 2007. No matter how working-age is defined, there has been a substantial decline in work among the native-born. Even if we define working-age as 18 to 65, rather than 16 to 65 or 25 to 54, it still shows a 15.5 million increase in the number of natives not working, while the number of immigrants not working is this age group is up 3.5 million. (See Figure 4.)
The only age group that has seen an improvement in their employment situation is those over age 60, especially those over 65. Table 1 reports employment for those 16 to 65 along with employment for all workers, including those over age 65. As discussed above, comparing the first quarter of 2000 to the same quarter in 2013 for the working age (16 to 65), shows that there was a 1.3 million decline in the number of natives working. However, looking at all workers 16-plus, including those over 65, shows that these older workers did make small employment gains. As a result there were 974,000 more natives (16-plus) of all ages working in 2013 than in 2000. Over the same time period, the number of immigrants workers (16-plus) increased by 5.7 million. This means that 15 percent of employment gains went to natives when those over 65 are included. This is still a tiny share of employment growth since natives accounted for two-thirds of population growth for those 16 to 65 and almost all of population growth for those over 65.
Competition for Jobs. There is good research indicating that immigration negatively impacts native employment. Borjas, Grogger, and Hanson in a 2010 article found that immigration reduces the employment of less-educated black men and increases their rate of incarceration.3 Their conclusions are similar to that of a 2010 academic study by Shihadeh and Barranco, which found that "Latino immigration raises black violence by first increasing black unemployment."4 These findings are supported by earlier work done by Kposowa, which also showed that immigration reduced black employment.5
Other academic studies have also found that immigration reduces job opportunities for natives. In its 1997 study of California, the Rand Corporation concluded that in that state alone competition with immigrants for jobs caused between 128,200 and 194,000 native-born workers in the state to withdraw from the workforce.6
A more recent analysis by Federal Reserve economist Christopher Smith found that immigration reduces the employment of U.S.-born teenagers.7 This is consistent with work by Andrew Sum, Harrington, and Khatiwada showing that immigration has a significant negative impact on the employment of younger workers.8 The recently published Congressional Budget Office cost estimate for the Gang of Eight immigration bill (S.744), indicates that just the increases in legal immigration in the bill will increase unemployment by about 150,000 through the year 2020.9 Although there is evidence that immigration reduces employment opportunities for natives, there remains a debate among economists about the extent of the job displacement. Putting aside the research, the dramatic decline in work among natives, and the enormous increase in the number not working, even before the recession, is strong evidence that labor is not in short supply in the United States.
Job Americans Don't Do? Part of the reason immigration is very likely to adversely impact the employment of natives is that, contrary to the assertion of some, the idea that immigrants only do jobs American do not want is mistaken. Of the 472 civilian occupations defined by the Department of Commerce, only six are majority immigrant (legal and illegal). These six occupations account for 1 percent of the total U.S. workforce. Many jobs often thought to be overwhelmingly immigrant (legal and illegal) are in fact majority native-born. For example, 51 percent of maids and housekeepers are U.S.-born, as are 63 percent of butchers and meat processors. It is also the case that 64 percent of grounds maintenance workers are U.S.-born, as are 66 percent of construction laborers and 73 percent of janitors.10 It is simply not the case that there are jobs that Americans do not do.
New Arrivals. The Center for Immigration Studies and other researchers have found that the level of new immigration is below the record levels it was a decade ago.11 However, the nation's immigration system continues to bring in a very large number of legal immigrants and new illegal immigrants continue to arrive, though in lower numbers. The CPS shows 5.44 million new immigrants (legal and illegal) of all ages arrived in the United States from the first quarter of 2008 to the first quarter of 2013. This implies about 1.1 million annual arrivals over the five years prior to the start of 2013.12 The monthly CPS from the first quarter of 2007, the peak of the last expansion, showed 6.56 million arrivals from the first quarter of 2002 to the first quarter of 2007, or 1.3 million arrivals annually over that five year period. Thus, based on the CPS, during the worst economic slowdown in the last 75 years, immigration fell by 17 percent compared to the expansion from 2002-2006. None of these figures are adjusted to reflect those missed by the survey, so the actual number is almost certainly higher in both five-year periods.
A 17 percent fall-off in new arrivals is not trivial, but it is not particularly large either. While the decline suggests that labor market conditions in the United States have an impact on the inflow of new immigrants, these results also indicate that the level of immigration does not fluctuate dramatically even under very different economic conditions. Put a different way, the United States remains a very attractive place for immigrants to settle even during a severe economic downturn. This fact coupled with the generous nature of America's legal immigration system helps explain why so many new immigrants arrived during and after the Great Recession.
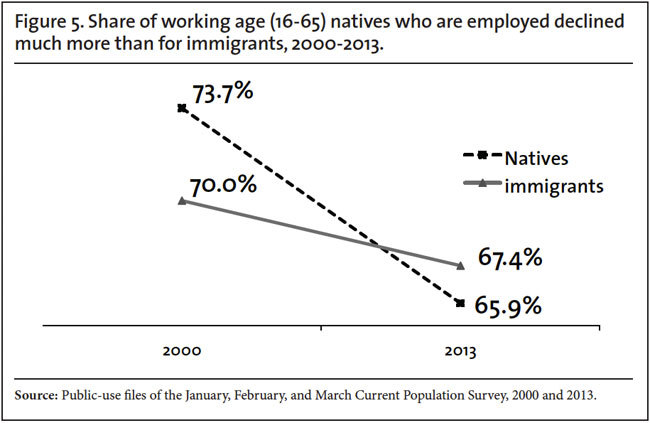
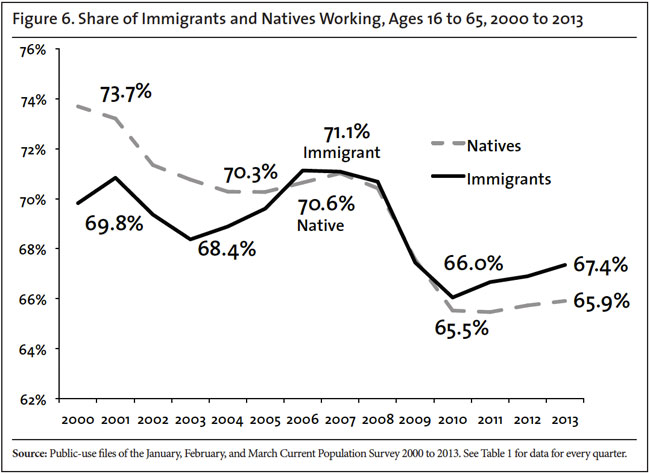
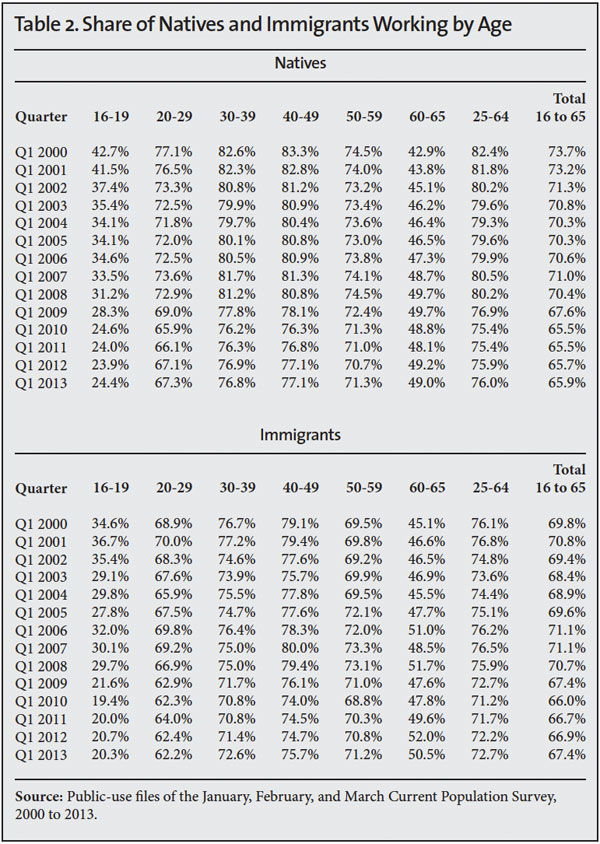
Long-Term Decline in Employment Rates. Because employment growth did not keep up with natural population increase and new immigration, the share of natives and immigrants holding a job was lower in the first quarter of 2013 than in the first quarter of 2000. Equally important, the decline in the share working began before the 2007 recession. Of working-age natives (16 to 65), 73.7 percent had a job in 2000; by 2007, at the peak of the last expansion, just 71 percent had a job, and in the first quarter of 2013 it was an abysmal 65.9 percent. The pattern for immigrants is somewhat different. The share of 16- to 65-year-old immigrants working was 69.8 percent in 2000, a good deal lower than for natives. But by 2007 the immigrant rate had increased to 71.1percent unlike the native rate (71 percent), which was lower in 2000 than in 2007. (See Figures 5 and 6 and Tables 1 and 2.)
With the recession after 2007, the employment rate for both immigrants and natives fell, but the decline was somewhat less pronounced for immigrants. The recovery in employment rates also has been somewhat more rapid for immigrants. As a result, in the first quarter of 2013 the employment rate for working-age immigrants was 67.4 percent and for natives it was 65.9 percent. The higher rate of employment for immigrants is a reversal of the situation in 2000. (See Figure 5 and Table 1.)
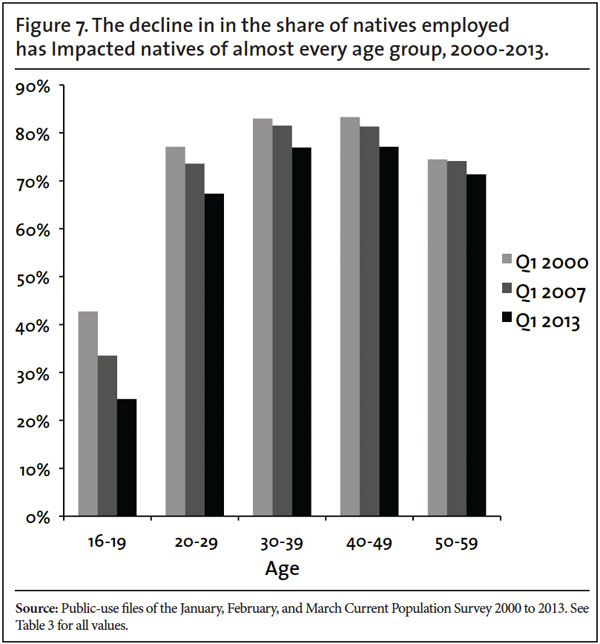
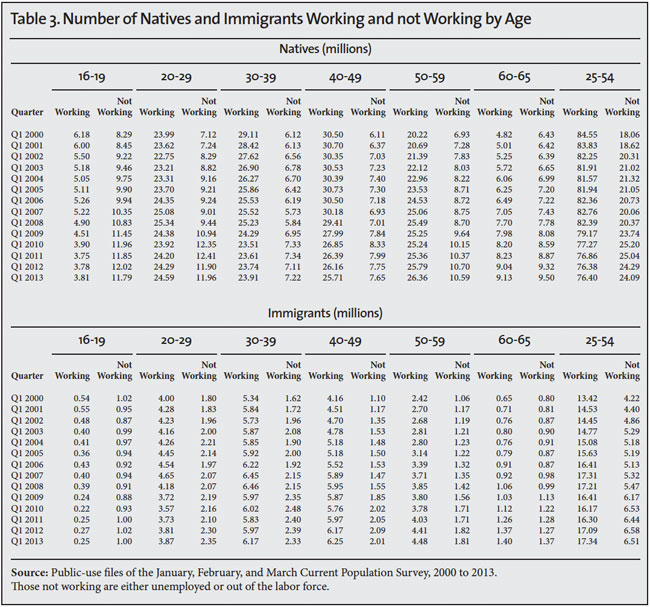
Decline in Work by Age. In addition to being more pronounced than the decline in immigrant employment, the decline in employment for natives is also striking because it is so broad. The share of natives in their teens, 20s, 30s, 40s, and 50s working has declined since 2000. (See Figure 7 and Tables 2 and 3.)13 The number of Americans not working has also increased for every age group. The number of teenagers 16 to 19 not working was 3.5 million larger in the first quarter of 2000 than in the first quarter of 2013. The number of natives 20 to 29 not working is up 4.8 million over the same time period, the number 30 to 39 not working is up 1.1 million, for those 40 to 49 the number not working increased by 1.5 million and the number 50 to 59 not working increased 3.7 million. (See Table 3.)
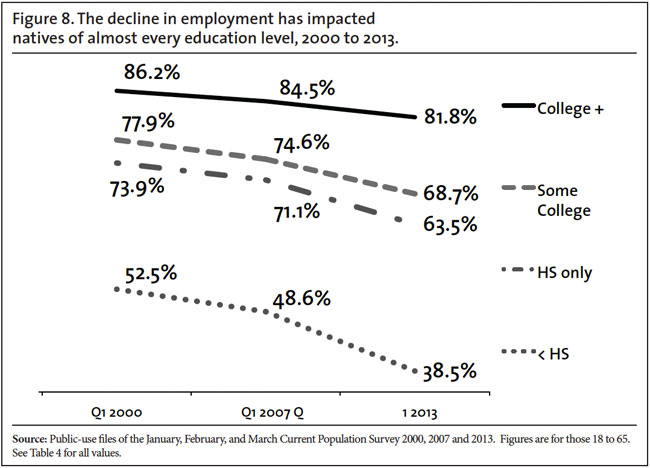
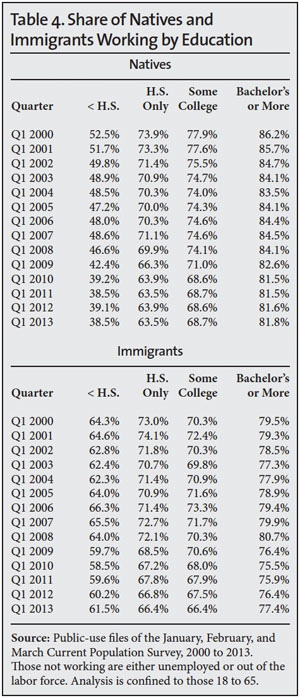
Decline in Work by Education. The same across-the-board decline in work among natives, even before the 2007 recession, can be seen by education as well. The working share of native-born high school dropouts, high school graduates, those with some college, and those with at least a bachelor's degree all declined from 2000 to 2007 and from 2007 to 2013. (Education figures are only for those 18 to 65.) While the decline in the share working has been more pronounced for those with only a high school education or less, even the share of natives with at least a bachelor's degree holding a job has declined significantly. This decline began before the Great Recession. The share of those with at least a bachelor's degree working declined from 86.2 percent in the first quarter of 2000 to 84.5 percent in the first quarter of 2007, even though those were the peak years of the last expansion. In the first quarter of 2013, only 81.8 percent of those with a bachelor's degree had a job. (See Figure 8 and Table 4.)
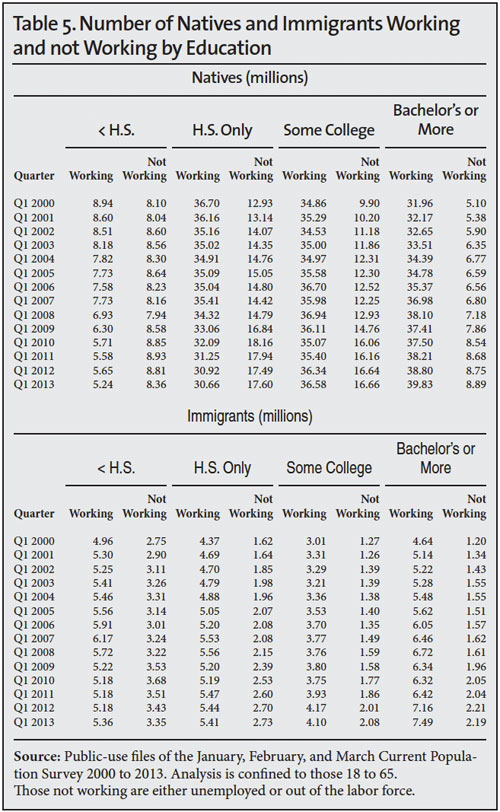
As expected, as the share not working has increased, the number not working has also increased for all educational groups. The number of natives with no more than high school education (18 to 65) not working is 4.9 million larger in 2013 than in 2000, the number with some college not working is up 6.8 million over this time period, and the number with at least a bachelor's degree not working is up 3.8 million. (See Table 5.) As is the case when examined by age, it is very difficult to find any evidence of a labor shortage, no matter what educational group is examined.
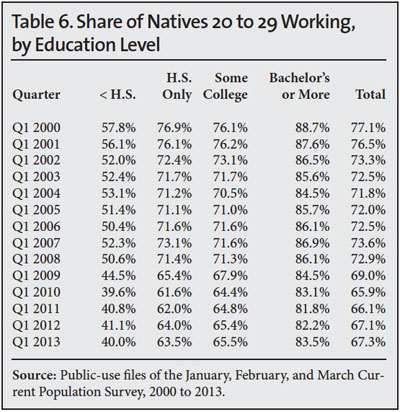
Workers in their teens and 20s have seen their employment rates fall the most. For those in their 20s, this is true for all education levels. Even college graduates in their 20s have seen a significant decline in their rate of employment, a decline that was going on before the recession. (See Table 6.) This decline in work for those under age 30 is consistent with the possibility that immigration is playing an important role in reducing the employment of natives. Immigrants are new entrants into the labor market and most people begin their working life in their teens and 20s. One would expect that if immigration is reducing the job prospects of natives, then it would be most likely to impact younger workers. Older workers who are more established in the labor market are less likely to be impacted by new arrivals.
In some ways, the decline in work among the young may be the most troubling because there is good evidence that not working when one is young has significant negative impacts on individuals in the long term. Research indicates that those who do not work in their youth often do not develop the skills and habits necessary to function well in the labor market, such as respecting authority, showing up on time, and following instructions. The very large decline in work among those under age 30 may have significant long-term negative consequences for those individuals as they age.14 The failure of young people to gain work experience earlier in their adult life may also have negative implications for the larger American society.
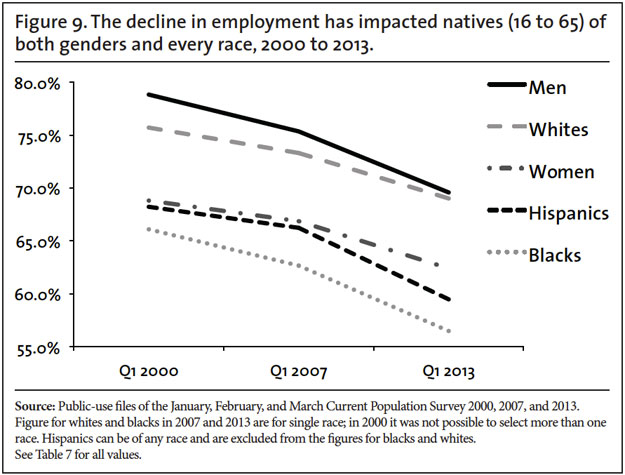
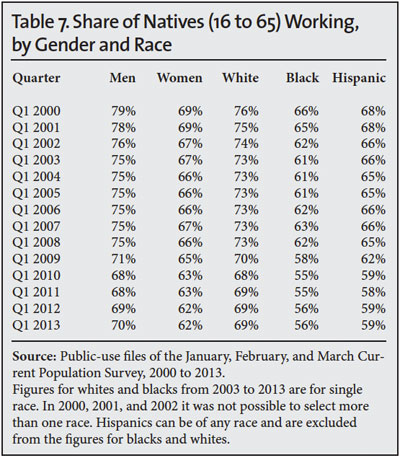
Decline in Work by Race and Gender. The broad nature of the decline in work among natives 16 to 65 also can be seen by looking at race and gender. The share of women and men working was lower in 2007 than in 2000 and was much lower in the first quarter of 2013. The same is also true for blacks, whites, and Hispanics. The decline in the share working tends to be the steepest for working-age men and for blacks from 2000 to 2007. Since 2007, the decline in the share with a job has also been somewhat steeper for men, blacks, and Hispanics. While the decline in work has been pronounced for these groups, native-born women have also seen their rate of employment decline, as have native-born whites. The decline is found from 2000 to 2007 as well as after 2007. (See Figure 9 and Table 7.)
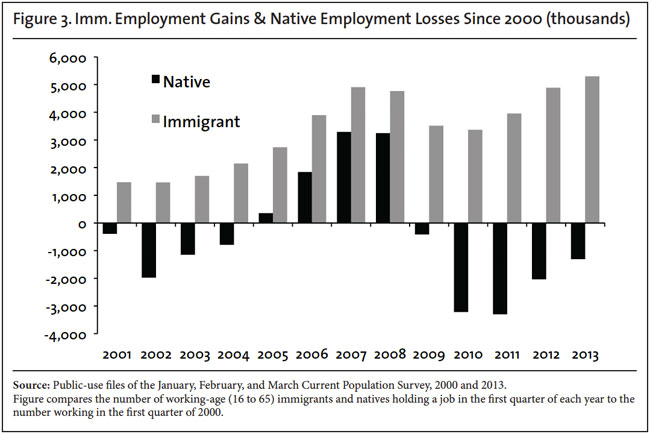
Recent Employment Growth. Taking the long view from 2000 to 2013 all of the net increase in the number of people working among the working-age has gone to immigrants, even though natives accounted for two-thirds of the increase in the overall size of the working-age population. However, more recently natives have done somewhat better. Since the job market started to recover, about half of the employment growth has gone to natives 16 to 65. Looking at the first quarter of 2010 compared to the first quarter of this year shows that the number of natives working has increased by 1.9 million and so has the number of immigrants working. Since immigrants account for 16 percent of workers it is still striking that half of employment growth has gone to the foreign-born. Moreover, the number of working-age natives not working has remained unchanged at 58.7 million because employment growth has barely kept pace with population growth among natives 16 to 65. The share of natives holding a job also barely improved. It was 65.5 percent in the first quarter of 2010 and it was 65.9 percent in the first quarter of this year a mere 0.4 percentage-point increase. In contrast, the share of immigrants working has improved a good deal more, from 66 percent in 2010 to 67.4 percent in 2013 a 1.4 percentage-point increase. (See Table 1 and Figure 6) This is simply no question that employment growth in the current recovery has been extremely weak, especially for natives.
Conclusion
It would be a mistake to think that every job taken by an immigrant is a job lost by a native. But it would also be a mistake to think that dramatically increasing the supply of workers has no impact on the employment prospects of natives. The idea that there are jobs American's don't do is simply not supported by the data. Moreover, there is good research showing that immigrants displace natives from the labor market.
Although the issue of native and immigrant job competition is not settled in the academic literature, there are several things we can say. First, and perhaps most important, the latest data do not support the argument that workers are in short supply in the United States. The decline in work among natives is very broad, impacting high school dropouts, those with a bachelor's degree, and every educational category in between. It has impacted workers of almost every age as well as men, women, blacks, whites, and Hispanics. Second, the decline in the share and number of natives working is consistent with the possibility that immigration is adversely impacting native employment, particularly the pronounced decline in work among the young who are new entrants into the job market.
Third, the available evidence does not support the idea that large-scale immigration necessarily creates job opportunities for natives, as some have argued. From the first quarter of 2000 to the first quarter of 2007, immigration levels were very high, yet the share of natives with a job actually fell. From 2008 to the start of 2013, an estimated 5.4 million new immigrants arrived, but job growth has been very weak during the recovery. The last 13 years, or even the last five years, make clear that large-scale immigration can go hand-in-hand with weak job growth and declining rates of work among the native-born. Given the employment situation in the country, the dramatic increases in legal immigration contemplated by the Gang of Eight immigration bill seem out of touch with the realities of the U.S. labor market.
Data and Methods
The two primary employment surveys collected by the United States Government are referred to as the "household survey" (also called The Current Population Survey or CPS) and the "establishment survey". The establishment survey asks employers about the number of workers they have. In contrast, the CPS asks people at their place of residence if they are working. While the two surveys show the same general trends, the figures from the two surveys do differ to some extent. The survey excludes those in prisons, nursing homes and other institutions.
Because it asks actual workers about their employment situation, only the CPS provides information about who is working, who is looking for work, and who is not working or looking for work. Moreover, only the CPS asks respondents about their socio-demographic characteristics such as race, education level, age, citizenship, and year of arrival in the United States. Thus the CPS can be used not only to compare employment growth among immigrants and the native-born, it can also be used to examine the share of different groups who are employed or unemployed or to make comparisons about any other measure of labor force attachment. For these reasons this analysis uses the public-use files of the CPS to examine employment in the United States by quarter.15
While the CPS is the primary source of data on the U.S. labor market, there are breaks in the continuity of the survey and this could slightly impact comparisons over time. This is due to periodic reweighting done by the Census Bureau to better reflect what it believes is the actual size of the U.S. population, such as after the decennial census. Any long-term study of poverty, wages, health insurance, and other socio-demographic characteristics that examines trends over several years can be slightly affected by reweighting. This issue exists with all government surveys, including the CPS. However, the reweighting effects both the native and immigrant population. Any effect from reweighting is small and does not impact the overall conclusion
of this analysis.
End Notes
1 We do not use the "establishment survey", which measures employment by asking businesses because that survey does not ask if an employee is an immigrant.
2 Table 1 reports employment for working-age (16 to 65) immigrants and natives for every quarter since 2000. It also reports the number of workers 16-plus holding a job. Comparing the first quarter of 2000 to the same quarter in 2013 for the working-age population shows that all of the employment growth has gone to immigrants. However, looking at all workers 16-plus shows that natives over age 65 did make small employment gains. As a result, there are 974,000 more natives of all ages working in 2013 than in 2000. The employment gains for immigrants are 5.7 million, so looking at all workers shows that just 15 percent of employment growth went to natives.
3 George J Borjas, Jeffrey Grogger, and Gordon H. Hanson, "Immigration and the economic status of black men", Economica 77, pp. 255-282, 2010.
4 Edward S. Shihadeh and Raymond E. Barranco, "Latino Employment and Black Violence: The Unintended Consequence of U.S. Immigration Policy", Social Forces, Vol. 88, No. 3, pp. 1,393-1,420, March 2010.
5 Augustine J . Kposowa, "The Impact of Immigration on Unemployment and Earnings Among Racial Minorities in the United Statess", Racial and Ethnic Studies, Vol. 18, 1995.
6 Kevin F. McCarthy and Georges Vernez, "Immigration in a Changing Economy: California's Experience", Rand Corporation, 1997.
7 Christopher L. Smith, "The Impact of Low-Skilled Immigration on the Youth Labor Market", Journal of Labor Economics, Vol. 30, No. 1, pp. 55-89, January 2012.
8 Andrew Sum, Paul Harrington, and Ishwar Khatiwada, "The Impact of New Immigrants on Young Native-Born Workers, 2000-2005", Center for Immigration Studies, September 2006.
9 The CBO states that the increase in legal immigration forecasted as a result of S.744 would increase unemployment by .1 percent or 150,000 in a labor force of 150 million. See page 9-10 of CBO report: "The Economic Impact of S. 744, the Border Security, Economic Opportunity, and Immigration Modernization Act", 2013.
10 See Steven Camarota and Karen Zeigler, "Are There Really Jobs Americans Won't Do? A detailed look at immigrant and native employment across occupations", Center for Immigration Studies, May, 2013.
11 Steven A. Camarota and Karen Zeigler, "A Shifting Tide: Recent Trends in the Illegal Immigrant Population", Center for Immigration Studies, July 2009. Steven A. Camarota and Karen Zeigler, "Homeward Bound: Recent Immigration Enforcement and the Decline in the Illegal Alien Population", Center for immigration Studies, July 2008. Jeffrey Passel, D'Vera Cohn and Ana Gonzalez-Barrera, "Net Migration from Mexico Falls to Zeroand Perhaps Less", Pew Hispanic Center, April 23, 2012. See Table 3 in Micheal Hoefer, Nancy Rytina and Bryan Baker, "Estimates of the Unauthorized Immigrant Population Residing in the United States: January 2011", DHS Office of Immigration Statistics, March 2012.
12 This is figure is from the public-use file of the Current Population Surveys for January, February, and March 2013. The survey asks immigrants when they came to the United States. The figure includes both legal and illegal immigrants.
13 The situation for those over age 50 is somewhat different than for younger workers. Table 2 does show a decline in the share working for 50- to 59-year-olds. But the overall number of natives 50 to 59 increased a good deal as did the number of natives in the 60- to 65-age range. This reflects the aging of the baby boom generation. From 2000 to 2013, the share of those in their 50s working fell even though the number with a job increased. Employment growth did not keep up with population growth for this age group so the share working declined. Those 60- to 65-year-olds did see their employment rate rise, unlike every other age group. For these individuals employment did keep up with population growth, though it is still the case that the number of 60- to 65-year-olds without a job went up by 3.1 million from 2000 to 2013.
14 For a review of this literature see pp. 4-5 in "Immigration and the Long-Term Decline in Employment Among U.S.-Born Teenagers", Center for Immigration Studies, May 2010.
15 For each quarter the CPS includes roughly 355,000 natives and 44,000 immigrants. The survey is then weighted to reflect the actual size of the U.S. population.
http://www.cis.org/print/immigrant-g...22ea4-44707457Join our FIGHT AGAINST illegal immigration & to secure US borders by joining our E-mail Alerts at http://eepurl.com/cktGTn
-
07-03-2013, 11:04 PM #3Administrator

- Join Date
- May 2006
- Location
- California
- Posts
- 65,443
Immigrants account for all job gains since 2000: native-born workers employment has
Immigrants account for all job gains since 2000: native-born workers employment has fallen
By Stephen Dinan
The Washington Times
Wednesday, July 3, 2013

Immigrants both legal and illegal have accounted for all of the job gains in the U.S. labor market since 2000, according to a report that highlights the stiff competition for jobs in a tight economy as Congress debates adding more workers to the mix.
The Center for Immigration Studies report, which is being released Wednesday, says 22.4 million immigrants of working age held jobs at the beginning of this year, up 5.3 million over the total in 2000. But native-born workers with jobs dropped 1.3 million over that same period, from 114.8 million to 113.5 million.
Meanwhile, the number of Americans who arent in the labor force at all has jumped by almost 13 million to reach 48.6 million a finding the reports authors say signals profound changes in the American job market and challenges conventional wisdom that immigration is good for the economy.
The last 13 years, or even the last five years, make clear that large-scale immigration can go hand-in-hand with weak job growth and declining rates of work among the native-born, the authors, Steven A. Camarota and Karen Zeigler, say in their report. Given the employment situation in the country, the dramatic increases in legal immigration contemplated by the Gang of Eight immigration bill seem out of touch with the realities of the U.S. labor market.
Whether immigrants compete for jobs is a heated topic though the Senate all but ignored it during the chambers debate on its bill to legalize most illegal immigrants and create opportunities for new immigrants and temporary workers to enter the U.S.
The outlines of those programs are coming into view. The Congressional Budget Office calculated that boosts in immigration and guest-worker programs would add about 12 million new people to the U.S. in 2023, in addition to millions of illegal immigrants who would gain legal status and work permits.
Overall, CBO said those added workers will help the U.S. economy, though the effect on wages is more complex. At the high-skilled and low-skilled ends there may be some slight wage slippage, CBO found, but wages for those in the middle would go up.
Still, what that means for individual workers is hotly debated outside Congress.
Alex Nowrasteh, immigration policy analyst at the Cato Institute, said the latest research suggests there isnt actually much competition for jobs between immigrants and native-born workers, particularly at the low-skilled level, because even there, both groups end up specializing.
He pointed to the example of a restaurant, where poor English might push low-skilled foreign workers toward jobs washing dishes or cleaning up, while native-born workers would specialize in jobs that require communications, such as waiting on tables.
Mr. Nowrasteh hadnt seen the latest Center for Immigration Studies report but questioned the numbers in a previous version, saying he had been unable to duplicate them in his own research.
Mr. Camarota defended his numbers, saying they came straight from the Census Bureaus Current Population Survey and that he used the same definitions of native-born and foreign-born that the CPS uses.
While the debate rages outside Congress, it was muted in the Senate where the chamber cleared its bill on a 68-32 vote last week.
In 2006 and 2007, the previous two times the Senate debated a broad immigration bill, the competition between native-born and immigrants was a major focus and helped sink the 2007 effort when Democrats pushed an amendment cutting the guest-worker program in half.
Mr. Nowrasteh said this time around, that debate was transferred to closed-door negotiations chiefly a deal between the AFL-CIO and the U.S. Chamber of Commerce on how to construct the future immigration and guest-worker parts of the bill.
With those two advocacy groups blessing, there was little dissent on the issue.
Just one amendment on the Senate floor dealt with potential competition for jobs, and that was a minor measure to require states to certify that their employers are actively trying to recruit American workers before businesses can try to recruit seasonal workers, who are often used at summer beach resorts or winter ski slopes. That amendment passed by voice vote.
I think this time around, the pro-immigration reform forces are much better organized and on the offensive, whereas in 2007 the anti-reform people were better organized and on the offensive, Mr. Nowrasteh said.
Mr. Camarota blamed the lack of a floor debate on the political pressure on both parties to get a deal done.
The Democrats dont want the issue to come up because theyre very anxious to make sure they get a legalization and there, he said.
As for the GOP, he said thats a matter of listening to businesses rather than looking at the data.
Every piece of data that the government collects on wages and employment does not support the idea that we have a labor shortage. The only piece of evidence that there is a shortage of workers is testimonials of owners of businesses that want access to more foreign labor, and thats what Republicans listen to, he said.
Sen. Jeff Sessions, an Alabama Republican who fought against the Senate bill, said he hopes that when the GOP-controlled House takes up the issue it will have more to say about immigrants competing for jobs.
This study underscores that the economic problem facing America right now is not too few workers but too many unemployed workers, Mr. Sessions said.
http://www.washingtontimes.com/news/...ns-since-2000/Support our FIGHT AGAINST illegal immigration & Amnesty by joining our E-mail Alerts at https://eepurl.com/cktGTn
-
07-28-2013, 12:16 PM #4Senior Member
- Join Date
- Feb 2005
- Posts
- 17,895
Join our FIGHT AGAINST illegal immigration & to secure US borders by joining our E-mail Alerts at http://eepurl.com/cktGTn


 Reply With Quote

72 Hours Till Deadline: Durbin moves on Amnesty
04-28-2024, 02:18 PM in illegal immigration Announcements