

Results 1 to 4 of 4
Thread Information
Users Browsing this Thread
There are currently 1 users browsing this thread. (0 members and 1 guests)
 LinkBack URL
 About LinkBacks
Threaded View


-
03-13-2014, 07:25 PM #1Senior Member


- Join Date
- Feb 2005
- Posts
- 17,893
Still No Evidence of a Labor Shortage Immigrant and native employment in the 4th Qtr
Center For Immigration Studies
By Steven A. Camarota, Karen Zeigler
March 2014
Still No Evidence of a Labor Shortage
Immigrant and native employment in the fourth quarter of 2013
Congress is currently considering immigration reform packages that include work permits for those in the country illegally, as well as substantial increases in future legal immigration. Yet the latest employment data continue to show an enormous number of working-age Americans not working, particularly those with modest levels of education.
Among the findings:
- In the fourth quarter of 2013, the standard unemployment rate (referred to as U-3) for native-born adults who have not completed high school was 16.6 percent, while for those with only a high school education it was 8.5. The U-3 unemployed are people who have looked for a job in the last four weeks.
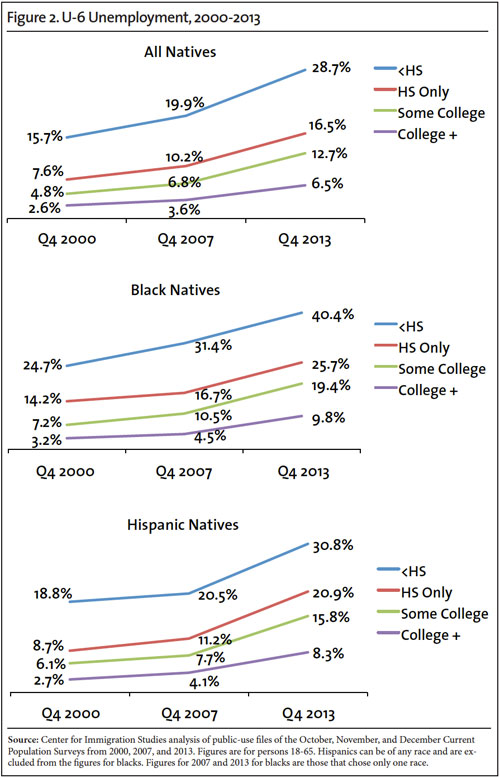
- The broader U-6 measure of unemployment which includes those want to work, but have not looked recently, and those forced to work part-time was 28.7 percent for native-born adults who have not completed high school and 16.5 percent for those with only a high school education.
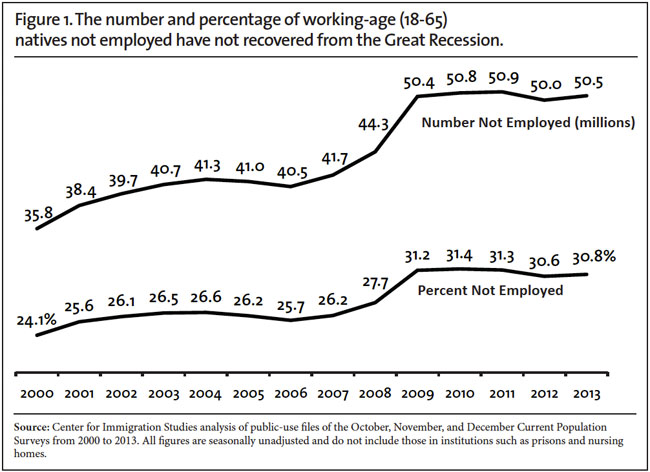
- The total number of native-born, working-age adults (18 to 65) of any education level not working (unemployed or out the labor force) was 50.5 million in the fourth quarter of 2012 8.8 million more than in the fourth quarter of 2007, and 14.7 million more than in the same quarter of 2000.
- The share of working-age (18 to 65) natives holding a job has not recovered from the Great Recession. In the fourth quarter of 2013, 31 percent were not working, something that has barely improved in the last five years.
- In the fourth quarter of 2013, there were only two working-age natives holding a job for every one that was not employed. This represents a huge deterioration. As recently as 2000, there were three working-age adults holding a job for every one not working.
Data and Methods
The two primary employment surveys collected by the U.S. government are referred to as the "household survey" (also called the Current Population Survey or CPS) and the "establishment survey". The establishment survey asks employers about the number of workers they have. In contrast, the CPS asks people at their place of residence if they are working. While the two surveys show the same general trends, the figures from the two surveys do differ to some extent.
Because it asks actual workers about their employment situation, only the CPS provides information about who is working, who is looking for work, and who is not working or looking for work. Moreover, only the CPS asks respondents about their socio-demographic characteristics such as education, age, citizenship, and year of arrival in the United States. Thus, only the CPS can be used to compare employment growth among immigrants and the native-born. For these reasons, this analysis uses the public-use files of the CPS to examine employment in the United States by quarter. (For each quarter, the three CPS surveys combined include roughly 355,000 natives and 44,000 immigrants. The survey is then weighted to reflect the actual size of the U.S. population.)
The CPS is the nation's primary source for unemployment and other labor force statistics. The data for the tables in this report come from the public-use files of the October, November, and December 2000, 2007, and 2013 Current Population Surveys, which are collected monthly by the Census Bureau for the Bureau of Labor Statistics (BLS).
Each individual CPS includes about 131,000 respondents, roughly half of whom are in the labor force. The tables presented here are reported by quarter. Quarterly data are more statistically robust, especially for smaller populations like immigrants and minorities, due to the inclusion of three months of data. Persons in institutions like prisons or nursing homes are not included in the CPS. Like all government surveys, the data are weighted to reflect the actual size and demographic makeup of the U.S. population.
The government publishes employment statistics that are both seasonally adjusted and unadjusted from the survey. The figures in this analysis are seasonally unadjusted. Unadjusted figures are computationally simpler and easier for other researchers to replicate. In general, the BLS does not provide separate estimates for the foreign-born (immigrants) and the U.S.-born broken down by characteristics like education, race, and age. However, all CPS respondents are asked these questions. The Census Bureau defines the foreign-born as persons who are not U.S. citizens at birth, which includes naturalized citizens, legal immigrants who are not citizens (green card holders), temporary visitors and workers, and illegal immigrants. All figures for the total U.S. population (ages 16-plus) at the top of Tables 2 and 4 match seasonally unadjusted figures from the BLS.
Defining Unemployment.
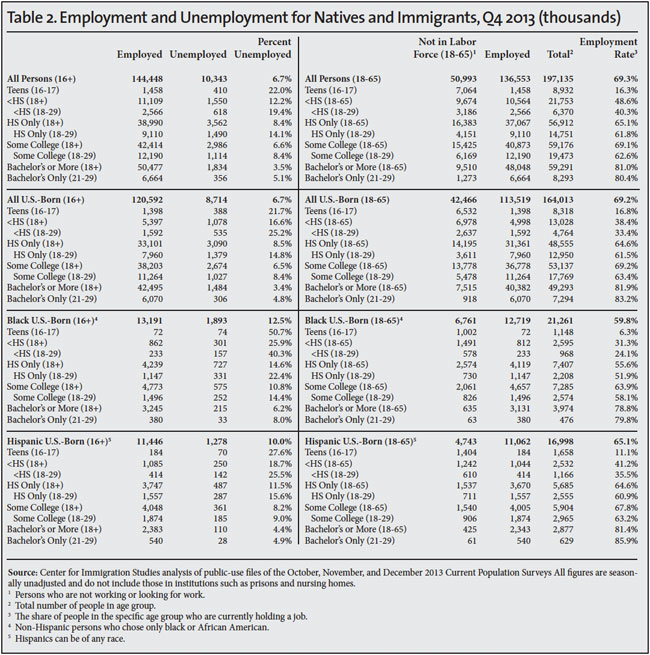
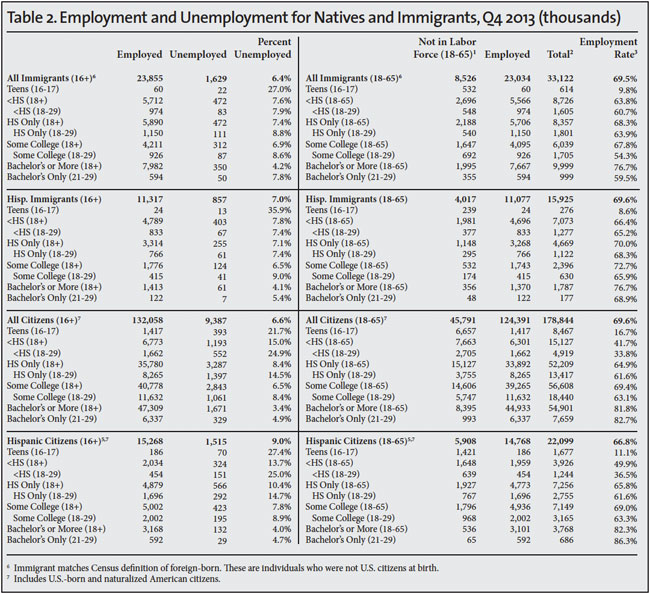
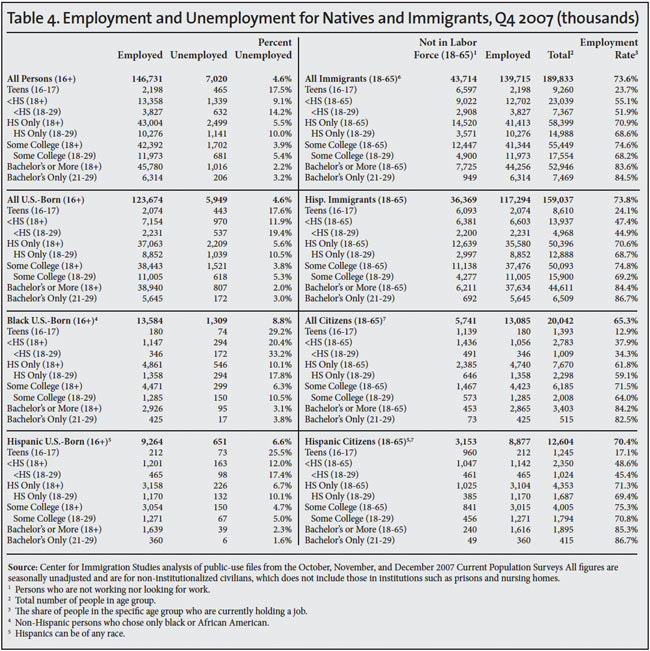
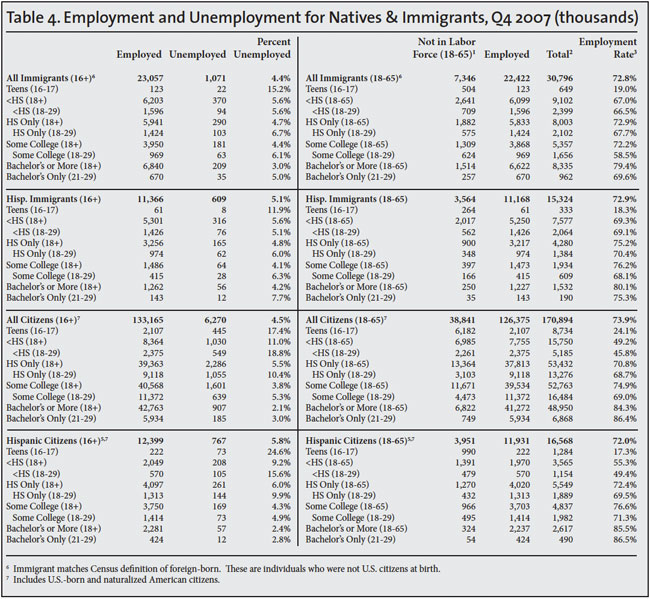
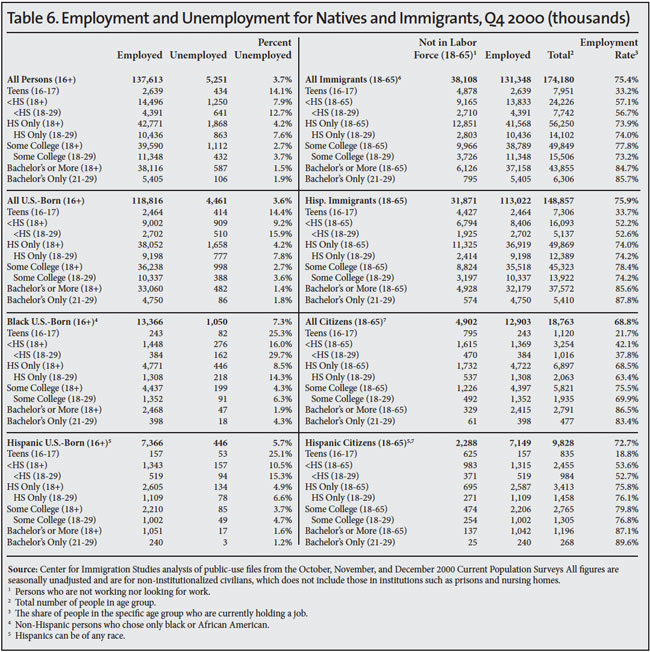
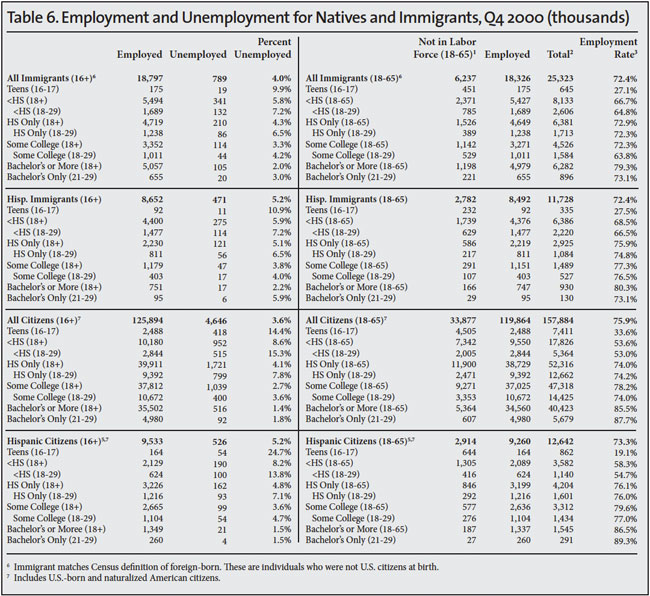
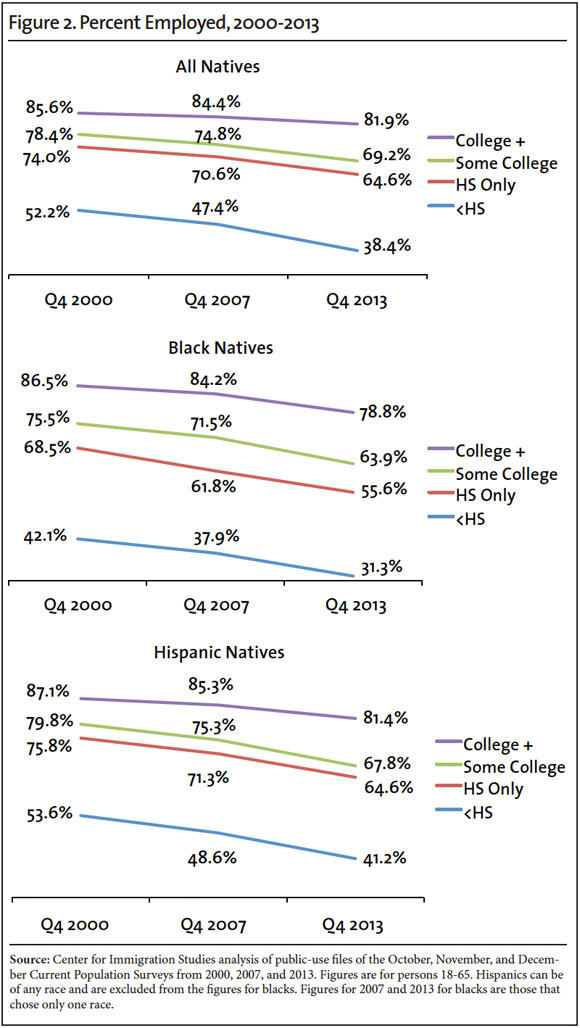
The standard measure of unemployment, referred to as U-3, takes the number of people who report that they are not working and have looked for a job in the last four weeks and divides it by the number actually working plus those looking for work. The left sides of Tables 2, 4, and 6 report U-3 unemployment for natives and immigrants by education and age for the fourth quarters of 2013, 2007, and 2000. The right sides of Tables 2, 4, and 6 report the share of each group working and not working. We focus on 2007 and 2000 because they represent the peak years of the last two economic expansions.
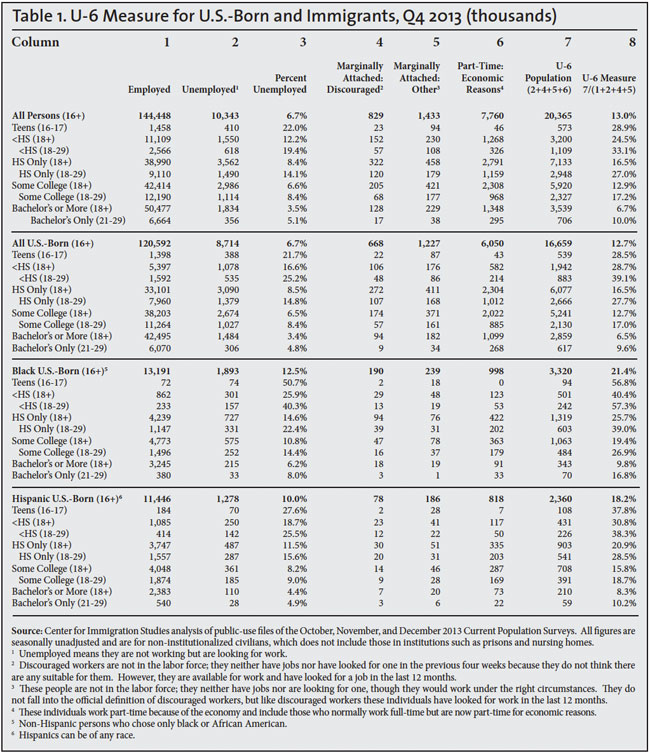
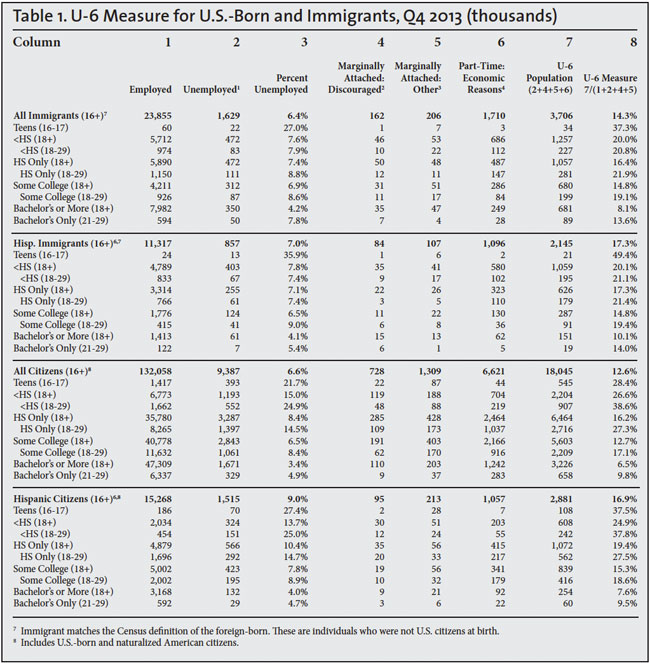
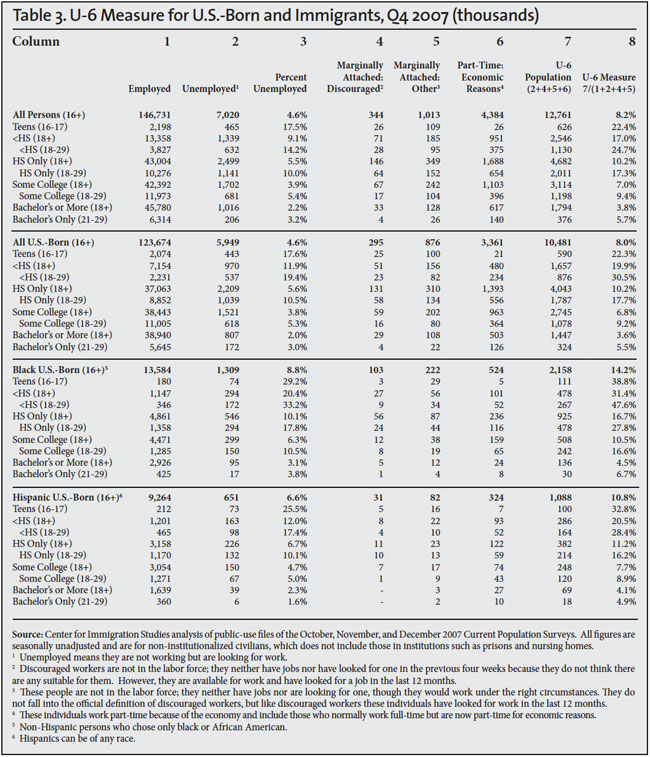
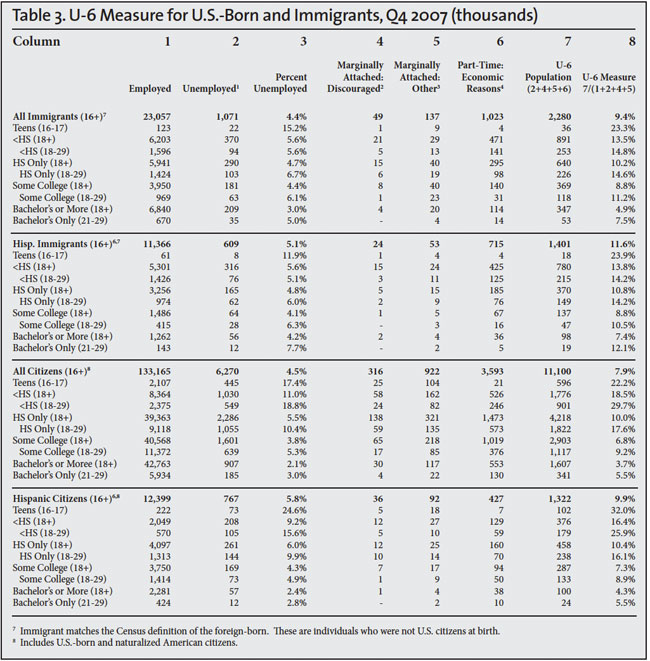
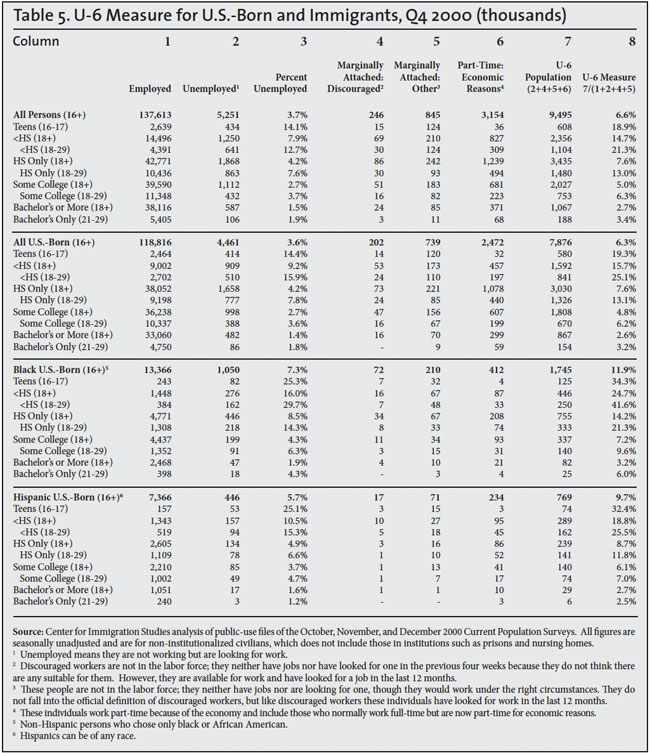
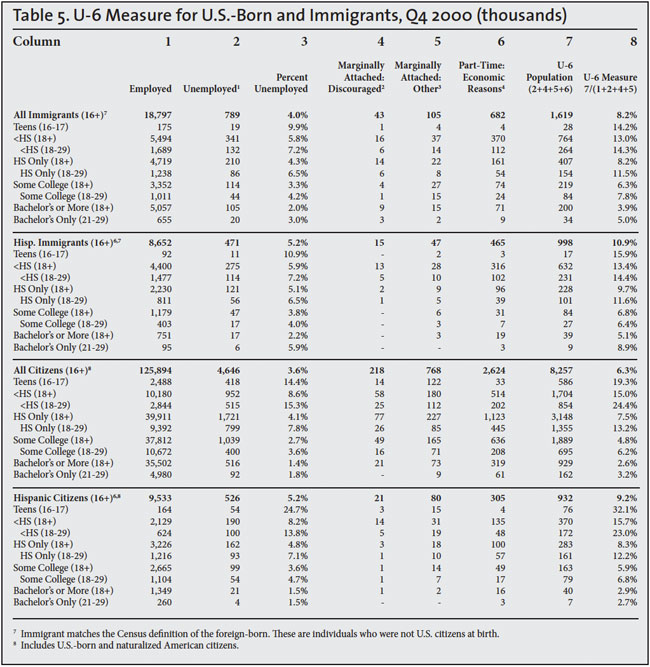
Those not actively looking for a job are not included in either the numerator or denominator when calculating the standard unemployment rate for U-3. The broader measure of unemployment, referred to as U-6, is calculated differently. It divides the sum of the unemployed population, involuntary part-time workers, and marginally attached people (discouraged and other) by the civilian labor force (employed and unemployed) plus marginally attached workers. The column headings in Tables 1, 3, and 5 show this calculation for the fourth quarters of 2013, 2007, and 2000; the last columns in the tables report the U-6 unemployment rate.
The following individuals are included in the U-6 measure: 1) Those who do not currently hold a job, but are available to work and have looked for a job in the previous four weeks standard U-3 unemployed; 2) marginally attached workers who indicate that they want and are available for jobs, and have looked for work in the past 12 months, but not in the last four weeks; and 3) involuntary part-time workers who report that they are working part-time for economic reasons. They want and are available for full-time work, but must instead settle for part-time hours. Because the total U-6 measure includes the U-3 unemployed, those working involuntarily part-time, and those marginally attached to the labor market (discouraged and other), it provides a broad measure of problems in the U.S. work force.
http://cis.org/u6-measure-still-no-e...labor-shortageJoin our FIGHT AGAINST illegal immigration & to secure US borders by joining our E-mail Alerts at http://eepurl.com/cktGTn


 Reply With Quote

Mamdani Thought HOMES SHOULD BE FREE Until 370,000 LOST...
07-09-2026, 02:11 PM in General Discussion