

Results 1 to 2 of 2
Thread Information
Users Browsing this Thread
There are currently 1 users browsing this thread. (0 members and 1 guests)
 LinkBack URL
 About LinkBacks
-
04-07-2012, 12:37 AM #1Senior Member


- Join Date
- May 2007
- Location
- South West Florida (Behind friendly lines but still in Occupied Territory)
- Posts
- 117,696
Not In Labor Force At New All Time High ~ 87,897,000
Not In Labor Force At New All Time High
Zero Hedge
April 6, 2012March NFP big miss at just 120K. Unemployment rate declines from 8.3% to 8.2%. Futures slide, for at least a few minutes before the NEW QE TM rumor starts spreading. The household survey actually posted a decline in March from 142,065 to 142,034. Considering Birth Death added 90K to the NSA number, the actual number was almost unchanged. And as always, as we predicted when Goldman hiked its NFP forecast yesterday from 175K to 200K saying if Goldmans recent predictive track record is any indication, tomorrows NFP will be a disaster, Goldie once again skewers everyone. Finally, Joe LaVorgnas +250,000 forecast was just 100% off as usual.
The unemployment rate drops to 8.2% for one simple reason: the number of people not in the labor force is back to all time highs: 87,897,000.

Birth Death:

» “Not In Labor Force” At New All Time High Alex Jones' Infowars: There's a war on for your mind!
Join our efforts to Secure America's Borders and End Illegal Immigration by Joining ALIPAC's E-Mail Alerts network (CLICK HERE)
-
04-07-2012, 08:03 AM #2Senior Member
- Join Date
- May 2007
- Location
- South West Florida (Behind friendly lines but still in Occupied Territory)
- Posts
- 117,696
Record 88 Million not in Labor Force- Complete Employment Analysis

Mike Shedlock
click on charts for sharper image
Quick Notes About the Unemployment Rate
- US Unemployment Rate dropped .01 to 8.2%
- In the last year, the civilian population rose by 3,604,000. Yet the labor force only rose by 1,315,000. Those not in the labor force rose by 2,289,000.
- The Civilian Labor Force fell by 164,000.
- Those "Not in Labor Force" increased by 310,000. If you are not in the labor force, you are not counted as unemployed.
- Those "Not in Labor Force" is at a new record high of 87,897,000.
- By the Household Survey, the number of people employed fell by 31,000.
- By the Household Survey, over the course of the last year, the number of people employed rose by 2,270,000.
- Participation Rate fell .1 to 63.8%
- Were it not for people dropping out of the labor force, the unemployment rate would be well over 11%.
Over the past several years people have dropped out of the labor force at an astounding, almost unbelievable rate, holding the unemployment rate artificially low. Some of this was due to major revisions last month on account of the 2010 census finally factored in. However, most of it is simply economic weakness.
Jobs Report at a Glance
Here is an overview of today's release.
- US Payrolls +120,000 - Establishment Survey
- US Unemployment Rate dropped .01 to 8.2% - Household Survey
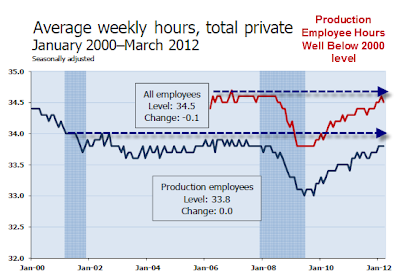
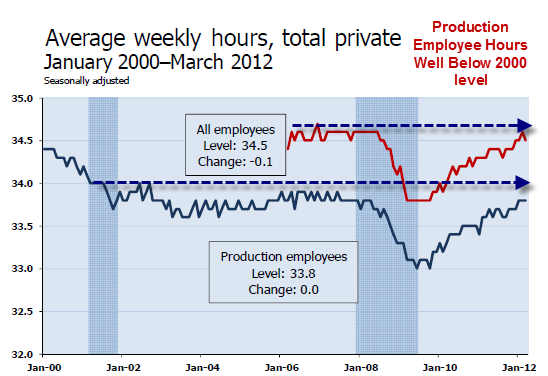
- Average workweek for all employees on private nonfarm payrolls fell .1 to 34.5 hours
- The average workweek for production and nonsupervisory employees on private nonfarm payrolls was unchanged at 33.8 hours.
- Average hourly earnings for all employees in the private sector rose by 5 cents.
Recall that the unemployment rate varies in accordance with the Household Survey not the reported headline jobs number, and not in accordance with the weekly claims data.
March 2012 Jobs Report
Please consider the Bureau of Labor Statistics (BLS) March 2012 Employment Report.
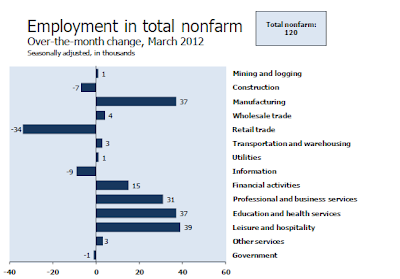
Nonfarm payroll employment rose by 120,000 in March, and the unemployment rate was little changed at 8.2 percent, the U.S. Bureau of Labor Statistics reported today. Employment rose in manufacturing, food services and drinking places, and health care, but was down in retail trade.
Unemployment Rate - Seasonally Adjusted

Nonfarm Employment - Payroll Survey - Annual Look - Seasonally Adjusted
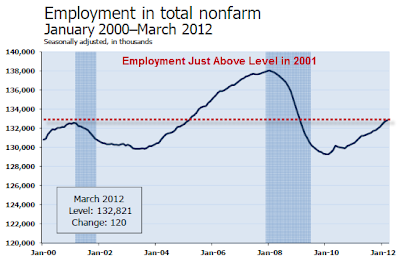
Actual employment is about where it was just prior to the 2001 recession.
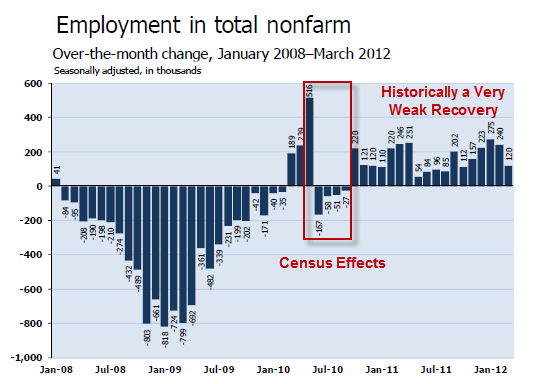
Nonfarm Employment - Payroll Survey - Monthly Look - Seasonally Adjusted
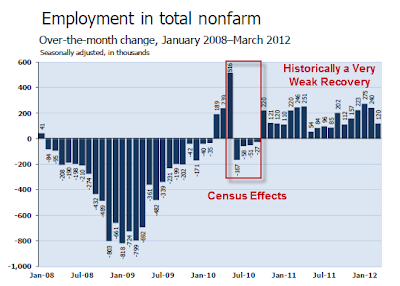
click on chart for sharper image
Between January 2008 and February 2010, the U.S. economy lost 8.8 million jobs.
Since a recent employment low in February 2010, nonfarm payrolls have expanded by 3.6 million jobs. Of the 8.8 million jobs lost between January 2008 and February 2010, 41 percent have been recovered.
Statistically, 125,000+- jobs a month is enough to keep the unemployment rate flat. For a discussion, please see Question on Jobs: How Many Does It Take to Keep Up With Demographics?
The average employment gain over the last 25 months has been 143,000, barely enough (statistically speaking) to make a dent in the unemployment rate.
Yet, the civilian unemployment rate has fell from 9.8% to 8.3%.
Current Report Jobs
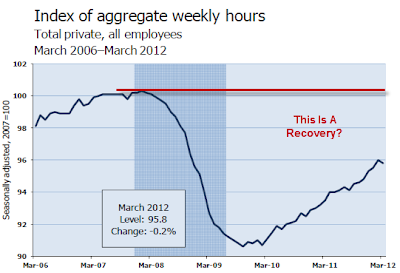
Average Weekly Hours
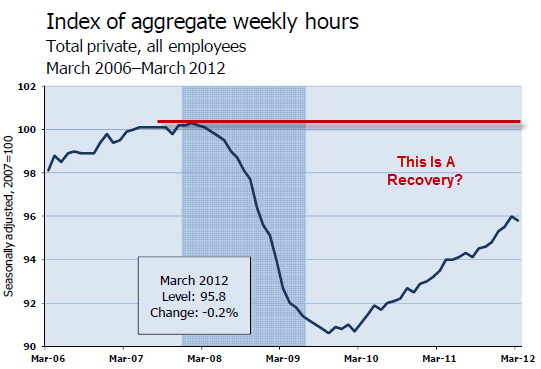
Index of Aggregate Weekly Hours
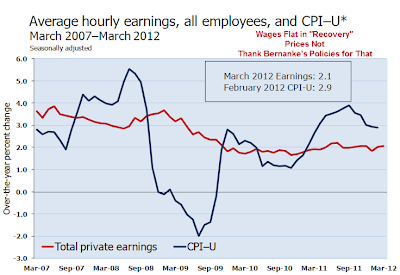
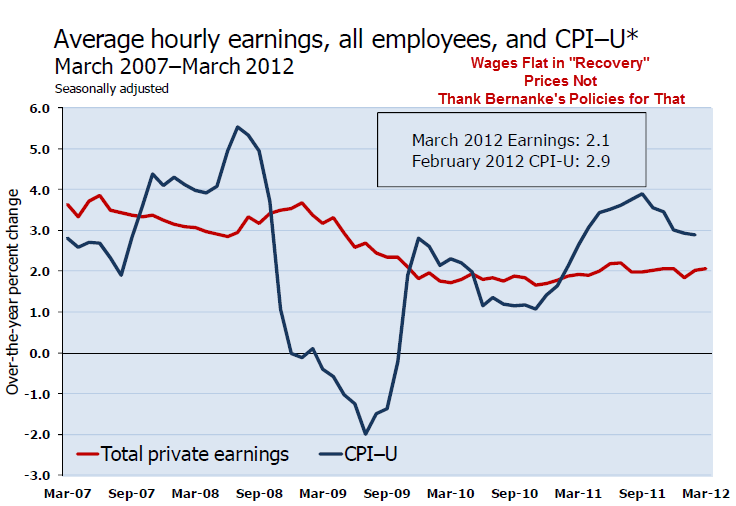
Average Hourly Earnings vs. CPI
"Success" of QE2 and Operation Twist
- Over the past 12 months, average hourly earnings have increased by 2.1 percent.
In February, the Consumer Price Index for All Urban Consumers (CPI-U) had an
over-the-year increase of 2.9 percent; growth in prices has recently been
outpacing growth in earnings. - Not only are wages rising slower than the CPI, there is also a concern as to how those wage gains are distributed.
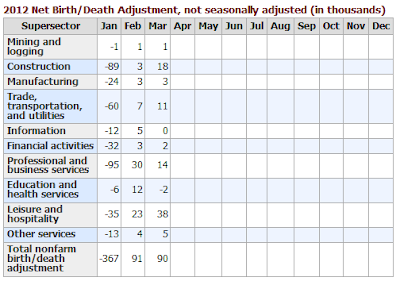
BLS Birth-Death Model Black Box
The BLS Birth/Death Model is an estimation by the BLS as to how many jobs the economy created that were not picked up in the payroll survey.
The Birth-Death numbers are not seasonally adjusted while the reported headline number is. In the black box the BLS combines the two coming out with a total.
The Birth Death number influences the overall totals, but the math is not as simple as it appears. Moreover, the effect is nowhere near as big as it might logically appear at first glance.
Do not add or subtract the Birth-Death numbers from the reported headline totals. It does not work that way.
Birth/Death assumptions are supposedly made according to estimates of where the BLS thinks we are in the economic cycle. Theory is one thing. Practice is clearly another as noted by numerous recent revisions.
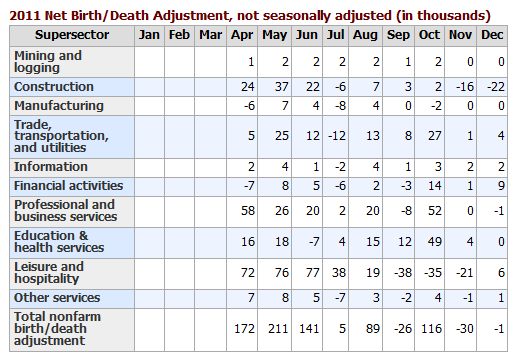
Birth Death Model Adjustments For 2011

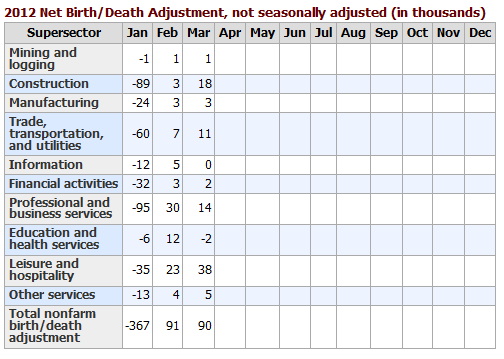
Birth Death Model Adjustments For 2012
Birth-Death Note
Once again: Do NOT subtract the Birth-Death number from the reported headline number. That approach is statistically invalid.
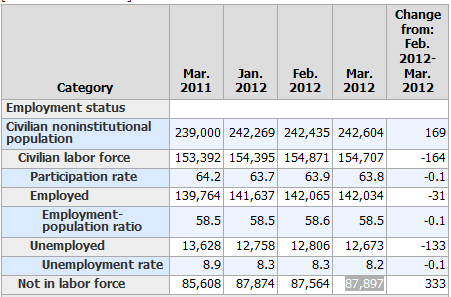
Household Survey Data
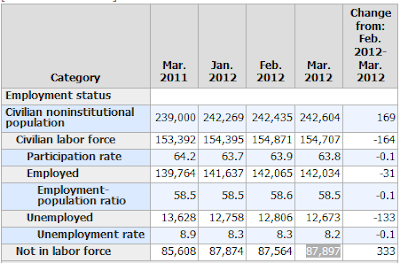
click on chart for sharper image
In the last year, the civilian population rose by 3,604,000. Yet the labor force only rose by 1,315,000. Those not in the labor force rose by 2,289,000.
That is an amazing "achievement" to say the least, and as noted above most of this is due to economic weakness not census changes.
Decline in Labor Force Factors
- Discouraged workers stop looking for jobs
- People retire because they cannot find jobs
- People go back to school hoping it will improve their chances of getting a job
- People stay in school longer because they cannot find a job
Were it not for people dropping out of the labor force, the unemployment rate would be well over 11%.
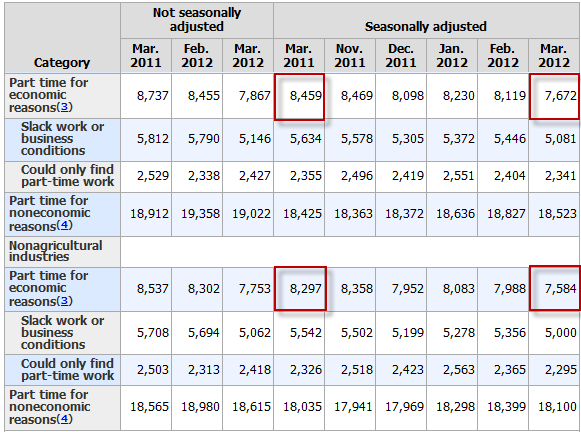
Part Time Status

click on chart for sharper image
There are 7,672,000 workers who are working part-time but want full-time work.
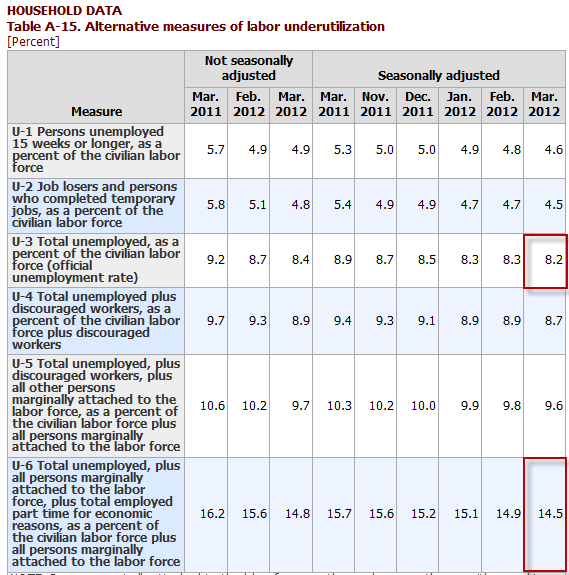
Table A-15

click on chart for sharper image
Table A-15 is where one can find a better approximation of what the unemployment rate really is.
Notice I said "better" approximation not to be confused with "good" approximation.
The official unemployment rate is 8.2%. However, if you start counting all the people that want a job but gave up, all the people with part-time jobs that want a full-time job, all the people who dropped off the unemployment rolls because their unemployment benefits ran out, etc., you get a closer picture of what the unemployment rate is. That number is in the last row labeled U-6.
U-6 is much higher at 14.5%. Both numbers would be way higher still, were it not for millions dropping out of the labor force over the past few years.
Grossly Distorted Statistics
Given the complete distortions of reality with respect to not counting people who allegedly dropped out of the work force, it is easy to misrepresent the headline numbers.
Digging under the surface, the drop in the unemployment rate over the past two years is nothing but a statistical mirage. Things are much worse than the reported numbers indicate.
Note the drop in U-6 unemployment this month as the Civilian Labor Force fell by 164,000. This is beyond statistical noise, to the point of pure statistical bullsheet.
Mike "Mish" Shedlock
Mish's Global Economic Trend Analysis
Record 88 Million not in Labor Force- Complete Employment Analysis - Mike Shedlock - Townhall Finance Conservative Columnists and Financial CommentaryJoin our efforts to Secure America's Borders and End Illegal Immigration by Joining ALIPAC's E-Mail Alerts network (CLICK HERE)


 Reply With Quote
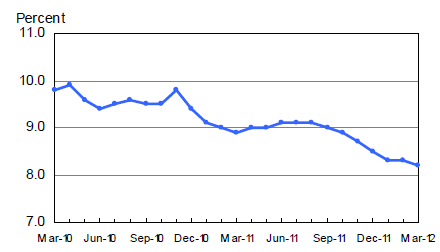


72 Hours Till Deadline: Durbin moves on Amnesty
04-28-2024, 02:18 PM in illegal immigration Announcements