

Results 1 to 1 of 1
Thread: 11% Unemployment Coming by May?
Thread Information
Users Browsing this Thread
There are currently 1 users browsing this thread. (0 members and 1 guests)
 LinkBack URL
 About LinkBacks
-
03-31-2010, 07:58 PM #1Senior Member


- Join Date
- May 2007
- Location
- South West Florida (Behind friendly lines but still in Occupied Territory)
- Posts
- 117,696
11% Unemployment Coming by May?
Wednesday, March 31, 2010
BLS Live Question and Answer Session on Friday, April 2nd http://www.bls.gov/chat/
The BLS has a Live Question and Answer session this Friday between 9:30 and 10:30 EST.
Requirements
1. Access to http://www.coveritlive.com
2. Version 10 or later of the Adobe Flash Player
You can submit questions in advance via Question and Answer Feedback Form http://data.bls.gov/cgi-bin/forms/cha?/chat/home.htm
Please save your question in case something goes wrong with the form or you need to resubmit it.
Seasonal Adjustment Amplitude
My question is on the the increasing amplitude of BLS seasonal adjustments as noted in BLS Seasonal Adjustments Gone Haywire; 11% Unemployment Coming by May? http://globaleconomicanalysis.blogspot. ... ywire.html
Seasonally Unadjusted Unemployment vs. Unadjusted Unemployment

The above chart shows how the BLS smoothes the unemployment rate to account for seasonal trends. It also give as hint as to an increasing magnitude of that smoothing.
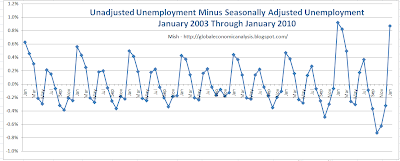
To highlight the month to month variances, I added a column to show the amplitude of the seasonal adjustments. The result is this chart.
Unadjusted Unemployment Minus Seasonally Adjusted Unemployment
For a larger picture go to this link .. to big to post on here
http://4.bp.blogspot.com/_nSTO-vZpSgc/S ... yment2.png
Seasonal Adjustment Highlights
There is always a big BLS adjustment in January
There is always a reversion to the mean that overshoots to the downside between March and April
There is always a secondary rebound back above the 0.0% line in July, followed by a smaller overshoot to the downside in October.
The problem is in the increasing amplitude of these swings, in both directions.
The BLS attempts to smooth trends in unemployment with seasonal adjustments but those swings have increasing amplitude for the last two years. One explanation I have heard is the BLS is assuming a normal population basis and applies seasonality to that.
If so, I believe their methodology is distorted by the fact there are 14.9 million unemployed. One should not assume the same seasonal bounce with so many out of work permanently.
Without an explanation from the BLS though, we are guessing at the cause.
Even without the increasing amplitude, the pattern shows the BLS overcompensates in January (understating unemployment by approximately .5% most years), with understatement on unemployment in 2009 by nearly 1%, and the same this year as well (although census reporting may distort 2010).
While we cannot expect seasonal adjustments to be perfect, we should not see what appears to be the same cyclical over-corrections year in and year out in exactly the same months. If the BLS has an explanation for this, I will post it.
Mike "Mish" Shedlock
http://globaleconomicanalysis.blogspot. ... on-on.htmlJoin our efforts to Secure America's Borders and End Illegal Immigration by Joining ALIPAC's E-Mail Alerts network (CLICK HERE)


 Reply With Quote


Leftists panic after Trump reveals plan to use military to carry...
05-09-2024, 12:27 AM in General Discussion