

Results 1 to 4 of 4
Thread Information
Users Browsing this Thread
There are currently 1 users browsing this thread. (0 members and 1 guests)
 LinkBack URL
 About LinkBacks
-
05-01-2014, 04:23 PM #1Senior Member


- Join Date
- Aug 2008
- Location
- PARADISE (San Diego)
- Posts
- 99,040
30% in OK. would like to leave state, IL. 50%, CT. 50%, MD. 47%
Gallup poll: 30 percent of Oklahomans would like to leave state

According to a recent Gallup poll, 30 percent of Oklahoma residents "would like to move." Tulsa World file
Posted: Thursday, May 1, 2014 2:33 pm | Updated: 3:09 pm, Thu May 1, 2014.
Every state has at least some residents who are looking for greener pastures, but nowhere is the desire to move more prevalent than in Illinois and Connecticut. According to the poll, 30 percent of Oklahoma residents "would like to move."
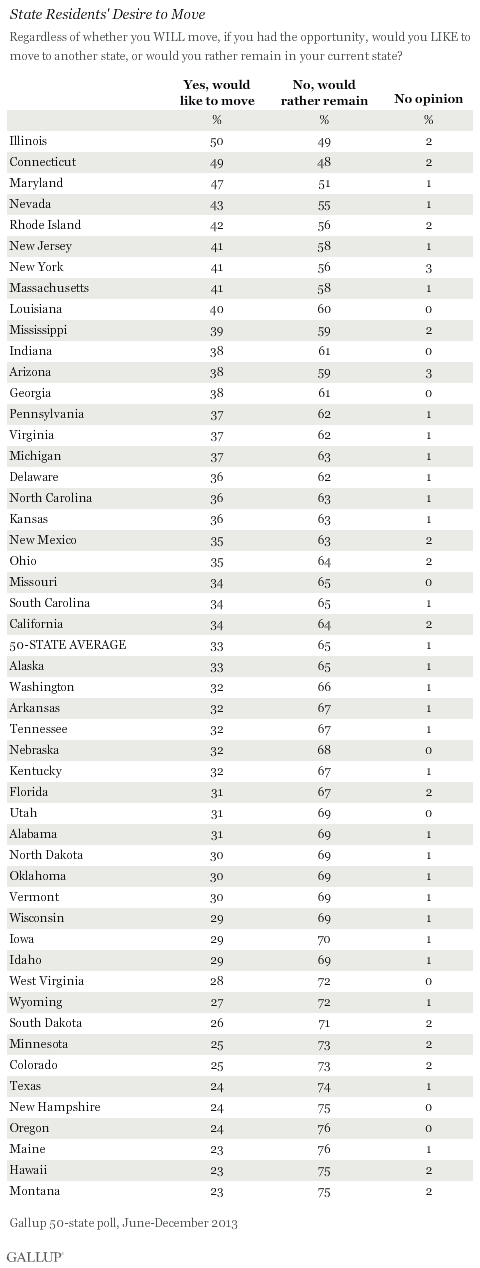
In Illinois and Connecticut, about half of residents say that if given the chance to move to a different state, they would like to do so. Maryland is a close third, at 47%.
These findings are from a 50-state Gallup poll, conducted June-December 2013, which includes at least 600 representative interviews with residents aged 18 and older in each state. Gallup measured residents' interest in moving out of state by asking, "Regardless of whether you will move, if you had the opportunity, would you like to move to another state, or would you rather remain in your current state?"
Thirty-three percent of residents want to move to another state, according to the average of the 50 state responses. Seventeen states come close to that 50-state average. Another 16 are above the average range, including three showing an especially high desire to move. In fact, in these three -- Illinois, Connecticut, and Maryland -- roughly as many residents want to leave as want to stay.
> Read full story at gallup.com
http://www.tulsaworld.com/dailybreak...7a43b2370.html
NO AMNESTY
Don't reward the criminal actions of millions of illegal aliens by giving them citizenship.
Sign in and post comments here.
Please support our fight against illegal immigration by joining ALIPAC's email alerts here https://eepurl.com/cktGTn
-
05-01-2014, 04:33 PM #2Senior Member
- Join Date
- Aug 2008
- Location
- PARADISE (San Diego)
- Posts
- 99,040
April 30, 2014
Half in Illinois and Connecticut Want to Move Elsewhere
Montana, Hawaii, Maine boast lowest rate of residents wanting to leave
by Lydia Saad
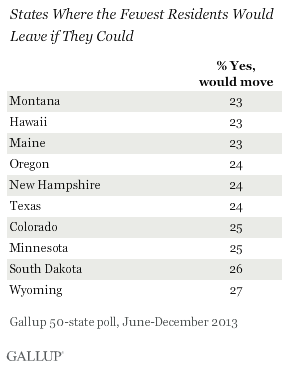
PRINCETON, NJ -- Every state has at least some residents who are looking for greener pastures, but nowhere is the desire to move more prevalent than in Illinois and Connecticut. In both of these states, about half of residents say that if given the chance to move to a different state, they would like to do so. Maryland is a close third, at 47%. By contrast, in Montana, Hawaii, and Maine, just 23% say they would like to relocate. Nearly as few -- 24% -- feel this way in Oregon, New Hampshire, and Texas.
These findings are from a 50-state Gallup poll, conducted June-December 2013, which includes at least 600 representative interviews with residents aged 18 and older in each state. Gallup measured residents' interest in moving out of state by asking, "Regardless of whether you will move, if you had the opportunity, would you like to move to another state, or would you rather remain in your current state?"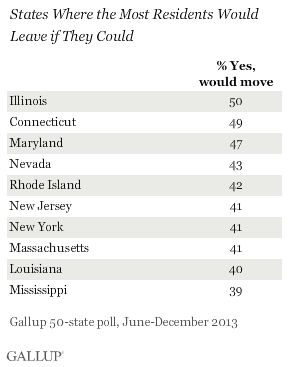
Thirty-three percent of residents want to move to another state, according to the average of the 50 state responses. Seventeen states come close to that 50-state average. Another 16 are above the average range, including three showing an especially high desire to move. In fact, in these three -- Illinois, Connecticut, and Maryland -- roughly as many residents want to leave as want to stay.
At the other end of the spectrum, 17 states are home to a below-average percentage of residents wanting to leave. This includes the previously mentioned six states -- Montana, Hawaii, Maine, Oregon, New Hampshire, and Texas -- where fewer than one in four want to move, the lowest level recorded. The detailed results for all 50 states are shown on page 2.
Nevada Residents Show Greatest Intention to Move in Next 12 Months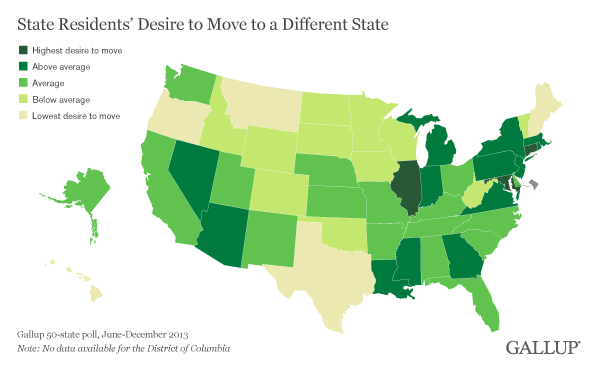
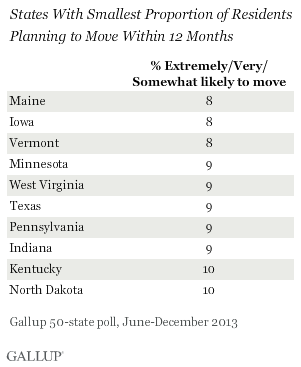
In the same poll, Gallup asked state residents how likely it is they will move in the next 12 months. On average across all 50 states, 6% of state residents say it is extremely or very likely they will move in the next year, 8% say it is somewhat likely, 14% not too likely, and 73% not likely at all.
The combined percentages reporting they are extremely, very, or somewhat likely to move out of state ranges from 8% in Maine, Iowa, and Vermont to 20% in Nevada. Although these figures are still high relative to the actual percentage of Americans who move out of state each year, they provide a basis for evaluating each state's risk of losing population that is somewhat stronger than the sheer desire of its residents to move.
Of course, all states enjoy an influx of new residents as well as outflows, so these intention-to-move data are only part of the population-change picture, but an important one.
Those saying it is at least somewhat likely they will move were asked to say why, in their own words. The biggest factor residents give for planning to move is for work or business reasons -- the 50-state average is 31%. This is followed by family or other social reasons (19%), weather or location (11%), and then seeking a better quality of life or change (9%).
In most states, it is not possible to view these answers because there are too few respondents, but in each of the 11 states with the highest percentages wanting to leave, roughly 100 answered the question. The breakdown of the open-ended responses for these 11 states is shown in the accompanying graph.
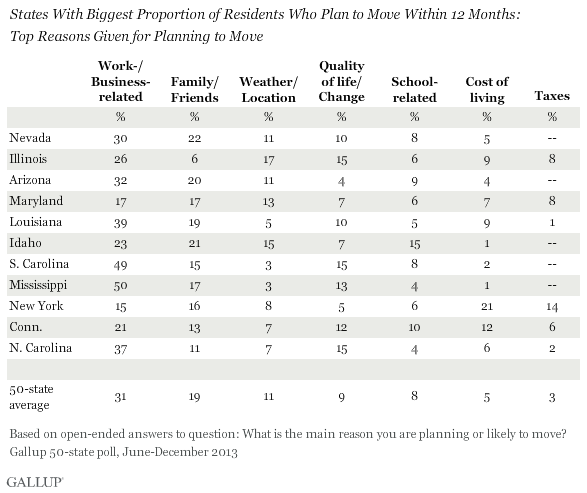
While not all of the percentage differences among the states are statistically significant because of small sample sizes, a few important ones stand out. Residents of Mississippi and South Carolina who indicate they are likely to move are significantly more likely to cite work- or business-related reasons than are their counterparts in other states.
The cost of living is a greater relative factor for residents in Connecticut and New York, while taxes are a uniquely important factor in New York, Illinois, and Maryland.
Bottom Line
State leaders have important reasons for wanting to see their state populations grow rather than shrink. A growing population usually means more commerce, more economic vitality, and a bigger tax base to pay for state services. A shrinking population not only hurts government coffers, but can weaken a state politically by virtue of the potential loss of U.S. House members through redistricting every 10 years.
Gallup's 50-state poll finds some states far better positioned than others to retain residents, and thus possibly attract new ones. This is evident in the wide variation in the percentages of state residents who say they would leave their state if they could, as well as in the percentages who say they plan to move in the next year.
Nevada, Illinois, Maryland, Louisiana, Mississippi, New York, and Connecticut all appear particularly vulnerable to losing population in the coming few years: high percentages of their residents say they would leave if they could, and larger-than-average percentages say they are at least somewhat likely to do so in the coming year. At the other end of the spectrum, Texas, Minnesota, and Maine have little to fear.
Residents of these states are among the least likely to want to leave and few are planning to leave in the next 12 months.
If these states sound familiar to readers of Gallup's previous 50-state poll articles, it's because several of them also appear at the top or bottom of the states for resident satisfaction with state taxes, state government, and overall perceptions of how their state compares to others as a place to live. Texas is in the top 10 on all three, while Illinois, Rhode Island, and Maryland rank in the bottom 10 on all three.
In upcoming articles, Gallup will analyze interstate migration patterns in greater detail, looking at where residents who are likely to move say they would move to.
http://www.tulsaworld.com/dailybreak...7a43b2370.html
NO AMNESTY
Don't reward the criminal actions of millions of illegal aliens by giving them citizenship.
Sign in and post comments here.
Please support our fight against illegal immigration by joining ALIPAC's email alerts here https://eepurl.com/cktGTn
-
05-01-2014, 05:04 PM #3Senior Member
- Join Date
- Aug 2008
- Location
- PARADISE (San Diego)
- Posts
- 99,040
California Stands Out as the State Where Americans Most - and Least - Want to Live
Looking to American cities, New York, NY is the object of similar love/hate thoughts
NEW YORK , N.Y. - September 5, 2013 - Someone light the candles! California, our nation's 31st state, celebrates its 164th birthday next Monday. Clearly many Americans think its best years are still ahead of it - when asked where, excluding their current state, they would most like to live,
The Golden State is at the top of the list; fellow oceanfront states Hawaii (2) and Florida (3) round out the top three, followed by Texas (4) and Colorado (5). But of course, even beloved locations can have their detractors - sometimes a lot of them. In fact, California is also the top selection as the state Americans would least like to live in.
These are some of the results of The Harris Poll of 2,286 U.S. adults surveyed online between August 14 and 19, 2013 by Harris Interactive.
Looking at the top 15 states where Americans would most want to live, California's #1 position represents a return to the spot it held from 2002 until Hawaii nabbed it in 2011, the most recent year this question was asked. However, despite some slight changes in order, the top 5 states this year are a repeat of 2011's top 5. The real up and comer this time around is The Empire State, with New York jumping from the 11th position in 2011 to the 6th this year.
The remaining 9 states on the "top 15" list represent a diverse mix, both geographically and culturally:
- Oregon (9) and Washington (10) bring Top 10 status home for the Pacific Northwest;
- Arizona (7) represents the Southwest in the Top 10;
- North Carolina (8), Virginia (11), Tennessee (=12) and South Carolina (=12) give the South a high number of representatives in the top 15;
- Pennsylvania (=12) represents the mid-Atlantic in the top 15; and
- Hawaii's fellow non-contiguous state, Alaska (15), rounds out the top 15.
Of course, California isn't the only state that has both admirers and detractors. Alaska and New York, both top 15 performers when Americans are asked where they would like to live, also round out the top 3 states where Americans would not want to live (2 and 3, respectively). Mississippi (4) and Florida (5) round out the top 5 for the dubious list, with Michigan (6), Texas (7), Alabama (8), the District of Columbia (9) and New Jersey (10) completing the top 10.
Favorite and Least Favorite Cities
Turning to cities Americans would (and would not) like to live in, it appears that states don't hold the sole rights to "love it or hate it" status: New York, NY is both the city Americans most and least want to live in (excepting where they live now). California is well represented among the top 5 most desired cities, with San Diego, Los Angeles and San Francisco nabbing spots 2-4, and Honolulu, HI rounds out the top 5. Seattle, WA (6); Denver, CO (=7); Portland, OR (=7); Miami, FL (9) and Boston, MA (10) fill out the rest of the top 10.
Los Angeles also appears in the top 5 cities Americans would least want to live in (at number 3), along with Detroit, MI (2); Chicago, IL (4) and Miami, FL (5). Washington, DC (6); Philadelphia, PA (=7); Houston, TX (=7); Las Vegas, NV (9) and Dallas, TX (10) complete this more dubious top 10 list.
To see other recent Harris Polls, please visit the Harris Poll News Room.
Want Harris Polls delivered direct to your inbox? Click here!
TABLE 1aSTATES WHERE MOST PEOPLE WOULD LIKE TO LIVE - APART FROM THEIR OWN STATE"If you could live in any state in the country, except the state you live in now, what state would you choose to live in?"Base: All U.S. Adults
19971998199920002001200220032005200620072009201020112013California 33252111111121Hawaii 7=7=973333233212Florida 11111222322333Texas 10=75=1012147=8564844Colorado 42324444755455New York *=15*=10885587119116Arizona 2564666698=6587North Carolina 6443758=844=6668Oregon 99151491011710910779Washington 812865910116=10=610910Virginia 1411=9=8=14=1291212=10*=141011Tennessee 561315107*1011=1091112=12South Carolina **********=12*15=12Pennsylvania ********1414***=12Alaska 1515=913=14=121514*15***15= Tied for that position* Not in top 15.NEW OR RETURNING TO TOP 15 THIS YEARPennsylvania (=12)Alaska (15)DROPPED OUT OF TOP 15 THIS YEARMontana (was 13)Nevada (was 14)
TABLE 1bTOP FIVE STATES - By Generation & Gender"If you could live in any state in the country, except the state you live in now, what state would you choose to live in?"Base: All U.S. adults
GenerationGenderRankEchoBoomers(18 to 36)Gen X(37 to 48)BabyBoomers(49 to 67)Matures(68+)MenWomen1CaliforniaHawaiiHawaiiHawaiiCaliforniaHawaii2FloridaFloridaFloridaArizonaFloridaCalifornia3New YorkCaliforniaCaliforniaColoradoHawaiiFlorida4HawaiiNew York & TexasTexasTexasTexasTexas5TexasColoradoCalifornia & FloridaNew YorkColorado
TABLE 2STATE WOULD LEAST LIKE TO LIVE IN"And, which state would you least like to live in?"Base: All U.S. Adults
2013California 1Alaska 2New York 3Mississippi 4Florida 5Michigan 6Texas 7Alabama 8District of Columbia 9New Jersey 10Illinois =11Arizona =11North Dakota 13Kansas =14Idaho =14Louisiana =14= Tied for that position
TABLE 3U.S. CITIES PEOPLE WOULD MOST LIKE TO LIVE IN OR NEAR TO"If you could live in or near any city in the country except the one you live in or nearest to now, which city would you choose?"Base: All U.S. Adults
19971998199920002001200220032005200620072009201020112013New York, NY 12111111111111San Diego, CA =7=795=2822324222Los Angeles, CA *14=13=12111051211=9156=133San Francisco, CA =513=6=223424=25=64Honolulu, HI ******=13867*1495Seattle, WA 242343=95435436Denver, CO 4=564=5=6=97=7=9=2910=7Portland, OR 12=12=15=12=13=14810=1214*=15=13=7Miami, FL 13**=14=1311=15**15*13*9Boston, MA =7=779=712=13111012710=610Las Vegas, NV *=1512=6=5=14435583511Chicago, IL 10=125=6=7=666911612812Austin, TX *******1515*11**13Atlanta, GA =534295119**13=7=1514Nashville, TN 11=911****15**12=711=15Phoenix, AZ 3=510=1010*713=128**=15=15= Tied for that position* Not in top 15
CITIES NEW OR RETURNING TO TOP 15 THIS YEARMiami (9), Austin (13)CITIES THAT DROPPED OUT OF TOP 15 THIS YEARDallas (was 4), Orlando (was 12)
TABLE 4CITY WOULD LEAST LIKE TO LIVE IN"And, which city would you least like to live in?"Base: All U.S. Adults
201020112013New York, NY 111Detroit, MI 222Los Angeles, CA 333Chicago, IL 454Miami, FL 695Washington, DC 746Philadelphia, PA 12*=7Houston, TX 57=7Las Vegas, NV =13=109Dallas, TX 9610Atlanta, GA *12=11Phoenix, AZ =1013=11Boston, MA 13*13San Francisco, CA 8=1014Orlando, FL **15= Tied for that position* Not in top 15
CITIES NEW OR RETURNING TO TOP 15 THIS YEARPhiladelphia (=7), Boston (13), Orlando (15)
CITIES THAT DROPPED OUT OF TOP 15 THIS YEARNew Orleans (was 8), Cleveland (was =14), Newark (was =14)http://www.harrisinteractive.com/New...5/Default.aspx
NO AMNESTY
Don't reward the criminal actions of millions of illegal aliens by giving them citizenship.
Sign in and post comments here.
Please support our fight against illegal immigration by joining ALIPAC's email alerts here https://eepurl.com/cktGTn
-
05-01-2014, 08:34 PM #4Senior Member
- Join Date
- Aug 2008
- Location
- PARADISE (San Diego)
- Posts
- 99,040
In Illinois and Connecticut, about half of residents say that if given the chance to move to a different state, they would like to do so. Maryland is a close third, at 47%.
NO AMNESTY
Don't reward the criminal actions of millions of illegal aliens by giving them citizenship.
Sign in and post comments here.
Please support our fight against illegal immigration by joining ALIPAC's email alerts here https://eepurl.com/cktGTn


 Reply With Quote

Durbin pushes voting rights for illegal aliens without public...
04-25-2024, 09:10 PM in Non-Citizen & illegal migrant voters