Results 1 to 1 of 1
Thread Information
Users Browsing this Thread
There are currently 1 users browsing this thread. (0 members and 1 guests)
-
08-25-2010, 01:44 AM #1Senior Member


- Join Date
- May 2007
- Location
- South West Florida (Behind friendly lines but still in Occupied Territory)
- Posts
- 117,696
Gold, Collapse Keynesian Economic Dogma, Fed Money Printing
Gold, the collapse of Keynesian Economic Dogma and Fed Money Printing
Commodities / Gold and Silver 2010 Aug 24, 2010 - 07:58 PM
By: Ned_W_Schmidt
Keynesian economic dogma continues down a path marked by complete failure. Fundamental belief of this ideology is that government can replace the private economy. Second rule is that government should replace the private sector. Flowing from that change should be a land of economic milk and honey. Except for one little thing, it does not work.
In the last twelve months the U.S. deficit was $1.536 trillion. At the same time, unemployment, per the government's headline statistic, is 9-10%. In the real world it seems that government deficits and unemployment are now, in the words of a statistician, positively correlated. When the deficit rises, unemployment goes up. See also Greece, Spain, et al.
Another economic misconception idolized by the Keynesians is that the prevailing rate of interest is the determinant of investment, of the economic kind like building factories and buying machine tools, in the economy. Per their thinking, the 0.25% Federal Funds rate in the U.S. should be now igniting an economic boom. Rather, U.S. is experiencing an economic flop. Double dip is so clearly on horizon Federal Reserves must wear triple-tinted, rose-colored glasses so as not to see it.
Onerous tax burdens and sledgehammer regulatory environment trump government spending and low interest rates. Obama Regime and Congress through the health tax, repeal of tax rate cuts, and onerous regulatory actions are crushing private investment in the U.S. economy. Where would you as a company CEO invest your next billion dollars? In the U.S. or China? Which is more pro investment and capital? The answer to all is China, that is if you are smarter than a 5th grader.
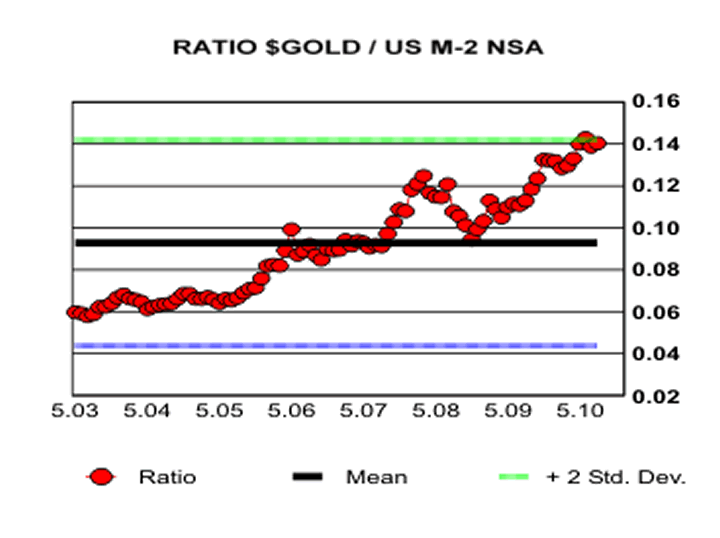
If the outlook is so dismal for the U.S. economy, why is not $Gold screaming upward? Well, the answer is that it is already up. $Gold's current price probably reflects both the Obama Economic Malaise and the quantity of U.S. dollars in existence. In the chart below is plotted, by the line of red circles, the ratio of price of $Gold to the quantity of U.S. money supply, M-2 NSA.

Black line is the mean of that ratio. Green line is the mean plus two standard deviations. Probability of the ratio, based on this data, being above that green line is less than 3%. Or, the probability of that ratio being below the green line is about 97%. When at green line as it is, ratio suggests that the price of $Gold is likely at full value relative to the quantity of U.S. dollars in existence.
All of this leads to two questions. What actions might the Federal Reserve take to overcome the Obama Economic Malaise? What might those actions mean for the price of $Gold?
Answer is that the Federal Reserve, awash in the failure of Keynesianism, has taken the first step toward QE, or Quantitative Easing. QE represents many things. It is first a white flag, indicating that the Federal Reserve is acknowledging its policies are failures. Second, it is the force feeding of the U.S. financial system with reserves. As this is much like the production process for foie gras, remember what happens to the goose.
We know more though. Japan pursued a policy of QE. That policy failed to reignite the Japanese economy. It did, however, cause the value of the yen to fall by more than 25%. We can expect similar results for the U.S. economy and the U.S. dollar.
Because of the inherent dangers of QE, policy makers are indeed moving slowly. First step is the reinvestment of the monthly cash flow on the $1.1 trillion of mortgage debt owned by the Federal Reserve. Second step is when they grab the goose by the neck and initiate force feeding. That latter step is yet to come. All of this, though, is public knowledge.

Participants in the Gold market are well aware of the coming of QE, and the consequences for the U.S. dollar of that policy. Such may be one of the reasons that $Gold did not have the Summer correction so many, including this author, expected. Investors, as suggested by the above chart, are enthusiastically embracing the outlook for Gold, perhaps too much so.
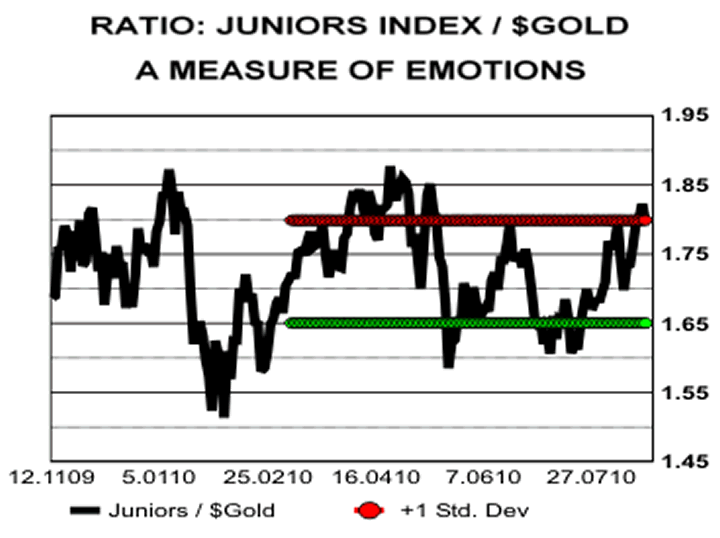
In that chart is plotted the ratio of MVGDXJ divided by the price of $Gold. MVGDXJ is the index of junior mining stocks used as the basis for GDXJ, the ETF. That ratio can be considered a measure of emotions, or enthusiasm for speculating in small mining stocks. The two horizontal lines in that graph are the mean of the history of that ratio plus and minus one standard deviation.
When that ratio is low, investors hate small mining stocks. They are selling, pushing down those stock prices relative to the price of $Gold. When the ratio is high, investors love small mining stocks. They are bidding up the stock prices enthusiastically relative to the price of $Gold.
As can be observed in that chart, the ratio is on the enthusiastic side. Probability of the ratio, based on the portrayed history, of being above the red line is about 16%. Investors are at the present time overly enthusiastic for the Gold sector. As also can be observed in that chart, such outbursts of emotions generally coincide with an already high price for $Gold. It suggests, one, avoiding Gold stocks, and, two, perhaps deferring the purchase of Gold to a later date.
Gold market is fully aware of the collapse of Keynesian economic dogma. It understands that the U.S. financial situation is untenable. It knows QE is coming, and that ultimately that policy will cause the U.S. dollar to lose in excess of 25% of its value. In fact, if we look at Gold in other major currencies, it seems everyone possible knows all this. When such is the case, a market is probably fully valued, at least in the short-term. Such is especially true when small children at funds are using it to trade the daily news ticker on such trivial matters as last month's U.S. home sales guess.
By Ned W Schmidt CFA, CEBS
http://www.marketoracle.co.uk/Article22162.htmlJoin our efforts to Secure America's Borders and End Illegal Immigration by Joining ALIPAC's E-Mail Alerts network (CLICK HERE)


 LinkBack URL
 About LinkBacks


 Reply With Quote

500,000 Illegals Caught on Arizona Ranch
05-02-2024, 09:08 AM in illegal immigration News Stories & Reports