

Results 1 to 1 of 1
Thread Information
Users Browsing this Thread
There are currently 1 users browsing this thread. (0 members and 1 guests)
 LinkBack URL
 About LinkBacks
-
10-05-2010, 04:51 PM #1Senior Member


- Join Date
- May 2007
- Location
- South West Florida (Behind friendly lines but still in Occupied Territory)
- Posts
- 117,696
Stock Market Red Flag From the Stalling Number of New Highs?
Stock Market Red Flag From the Stalling Number of New Highs?
Stock-Markets / Stock Markets 2010
Oct 05, 2010 - 11:15 AM
By: Marty_Chenard
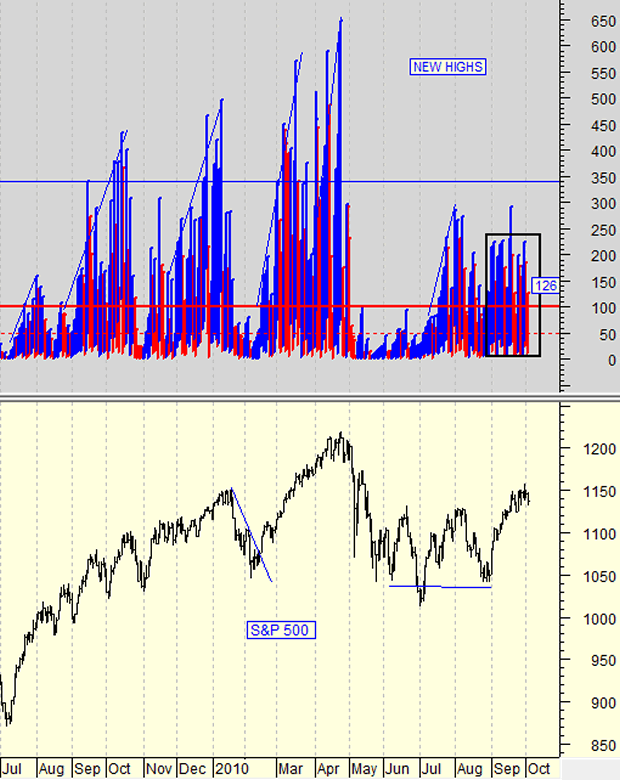
In the past few weeks, we have been pointing out that the daily New Highs on the New York Stock exchange were not behaving in a fashion that suggested a healthy rise in the market. We commented that healthy rallies had buyers chasing stocks and bidding them up higher ... which in turn pushed the number of stocks reaching New Highs up higher in a trending fashion.
Last week, we showed the chart below and commented that: "There was NO up trend going on which was a red flag to be concerned about."
Today, we will post another chart on the New Highs which is our "New Highs Trending Indicator". Please scroll below to see this chart and the commentary ...
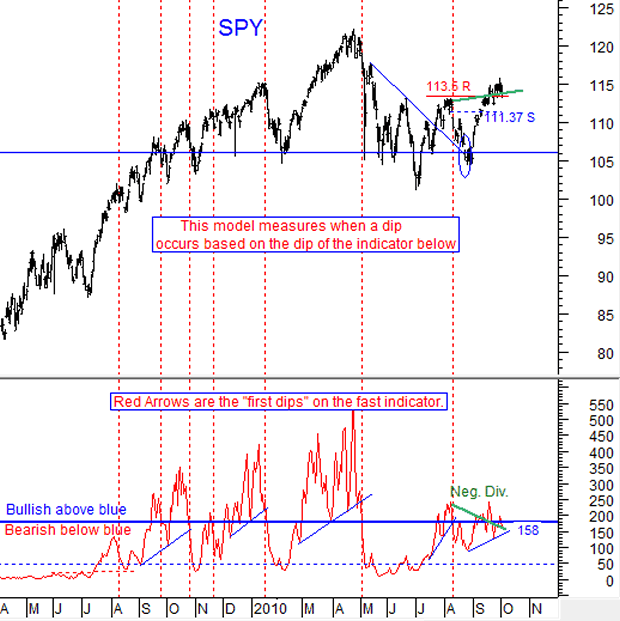
New Highs Trending Indicator ...
*** Our New Highs Trender Indicator closed at 158 yesterday, which was 22 points below our important 180 level.
What is important on this chart, is what has been going on with the indicator since August: It is currently lower than the peak at the beginning of August, while the SPY is conversely higher than the beginning of August. Therefore, this indicator is showing a negative divergence ... see the green lines.
Conclusion: The negative divergence says that the market's health may be in jeopardy. Friday's employment report will be very important, but in the meantime, this model is saying that the market is less confident than many investors think it is.
Indicator Explanation: The New Highs model below is pretty self explanatory. The up moves on the SPY correlate with New Highs being above 180 on this model ... the 180 level is a horizontal blue line. *** When the New Highs Fast Indicator turns to the downside, the SPY falls as seen by the vertical red lines. * This Indicator is posted every day on our paid subscriber site and is presented as a courtesy to our Free Members today.
By Marty Chenard
http://www.stocktiming.com/Join our efforts to Secure America's Borders and End Illegal Immigration by Joining ALIPAC's E-Mail Alerts network (CLICK HERE)


 Reply With Quote

Americans Want Congress to Act on Border Security. Will They?
05-04-2024, 10:39 AM in illegal immigration News Stories & Reports