

Results 1 to 10 of 13
Thread Information
Users Browsing this Thread
There are currently 1 users browsing this thread. (0 members and 1 guests)
 LinkBack URL
 About LinkBacks
Hybrid View


-
02-03-2012, 07:01 PM #1Senior Member


- Join Date
- May 2007
- Location
- South West Florida (Behind friendly lines but still in Occupied Territory)
- Posts
- 117,087
Record 1.2 Million People Fall Out Of Labor Force In One Month, Labor Force Participa
Record 1.2 Million People Fall Out Of Labor Force In One Month, Labor Force Participation Rate Tumbles To Fresh 30 Year Low

Submitted by Tyler Durden on 02/03/2012 08:51 -0500
A month ago, we joked when we said that for Obama to get the unemployment rate to negative by election time, all he has to do is to crush the labor force participation rate to about 55%. Looks like the good folks at the BLS heard us: it appears that the people not in the labor force exploded by an unprecedented record 1.2 million. No, that's not a typo: 1.2 million people dropped out of the labor force in one month! So as the labor force increased from 153.9 million to 154.4 million, the non institutional population increased by 242.3 million meaning, those not in the labor force surged from 86.7 million to 87.9 million. Which means that the civilian labor force tumbled to a fresh 30 year low of 63.7% as the BLS is seriously planning on eliminating nearly half of the available labor pool from the unemployment calculation. As for the quality of jobs, as withholding taxes roll over Year over year, it can only mean that the US is replacing high paying FIRE jobs with low paying construction and manufacturing. So much for the improvement.
Chart below shows it all - that jump is not a fat finger!

And Labor Force Participation:

This is the largest absolute jump in 'Persons Not In Labor Force' on record...and biggest percentage jump in 30 years.

Chart: Bloomberg
ZeroHedge | On a long enough timeline the survival rate for everyone drops to zero-Join our efforts to Secure America's Borders and End Illegal Immigration by Joining ALIPAC's E-Mail Alerts network (CLICK HERE)
-
02-03-2012, 07:03 PM #2Senior Member
- Join Date
- May 2007
- Location
- South West Florida (Behind friendly lines but still in Occupied Territory)
- Posts
- 117,087
Nonfarm Payroll Surge... On Gain From "Low Wage Jobs", Delay In Courier, Messenger Job Drop
Submitted by Tyler Durden on 02/03/2012 09:08 -0500
Great news from today's BLS report, right (when one excludes that record 1.2 million explosion in people out of the labor force of course)? Wrong. As is well known banks have been firing workers left and right: these are the jobs that actually matter in the grand withholding taxes scheme of things. Yet someone is getting hired supposedly. Well, as we suggested before the NFP report, this is merely rotation from high paying jobs to "low-wage jobs." And no, it's not our words - this is what CRT Capital says. Per Bloomberg: About 113k of NFP gain from “low wage jobs,” David Ader, strategist at CRT Capital Group, writes in note. Additionally, “we didn’t see the drop in courier and messengers as expected - but suspect we will." Moreover, ‘‘long-term stress remains at the U6 measure at 15.1% is still high, but likely falling due to people leaving labor force, and duration on unemployment remains over 40 weeks." But yes, it is an election year, so by November expect the labor participation rate to be under 60% and the unemployment rate to drop to under 6%, or some other propaganda BS.
Nonfarm Payroll Surge... On Gain From "Low Wage Jobs", Delay In Courier, Messenger Job Drop | ZeroHedgeJoin our efforts to Secure America's Borders and End Illegal Immigration by Joining ALIPAC's E-Mail Alerts network (CLICK HERE)
-
02-03-2012, 07:05 PM #3Senior Member
- Join Date
- May 2007
- Location
- South West Florida (Behind friendly lines but still in Occupied Territory)
- Posts
- 117,087
Implied Unemployment Rate Rises To 11.5%, Spread To Propaganda Number Surges To 30 Year High
Submitted by Tyler Durden on 02/03/2012 09:35 -0500
Sick of the BLS propaganda? Then do the following calculation with us: using BLS data, the US civilian non-institutional population was 242,269 in January, an increase of 1.7 million month over month: apply the long-term average labor force participation rate of 65.8% to this number (because as chart 2 below shows, people are not retiring as the popular propaganda goes: in fact labor participation in those aged 55 and over has been soaring as more and more old people have to work overtime, forget retiring), and you get 159.4 million: that is what the real labor force should be. The BLS reported one? 154.4 million: a tiny 5 million difference. Then add these people who the BLS is purposefully ignoring yet who most certainly are in dire need of labor and/or a job to the 12.758 million reported unemployed by the BLS and you get 17.776 million in real unemployed workers. What does this mean? That using just the BLS denominator in calculating the unemployed rate of 154.4 million, the real unemployment rate actually rose in January to 11.5%. Compare that with the BLS reported decline from 8.5% to 8.3%. It also means that the spread between the reported and implied unemployment rate just soared to a fresh 30 year high of 3.2%. And that is how with a calculator and just one minute of math, one strips away countless hours of BLS propaganda. Difference between Reported and Implied Unemployment Rate

And why the Labor Force Participation rate is not declining due to retirement.

http://www.zerohedge.com/news/implie...s-30-year-high
Join our efforts to Secure America's Borders and End Illegal Immigration by Joining ALIPAC's E-Mail Alerts network (CLICK HERE)
-
02-03-2012, 07:07 PM #4Senior Member
- Join Date
- May 2007
- Location
- South West Florida (Behind friendly lines but still in Occupied Territory)
- Posts
- 117,087
Non-Manufacturing ISM Ignores Banker Layoffs, Surges Past Expectations On Biggest Jump In Employment Index Ever
Submitted by Tyler Durden on 02/03/2012 10:18 -0500
And another major economic indicator beat, this time coming from the January Non-manufacturing ISM data, which unlike yesterday's miss in the manufacturing ISM, surged past estimates of 53.2, up from a revised 53.0 in December, to a whopping 56.8 in January. The primary reason for this was the reported jump in Employment which rose from 49.8 to 57.4, which was the biggest jump pretty much ever (see chart below), and the highest employment number since 2006. And this happened in a month in which the banking sectors laid of thousands of bankers. Brilliant. We leave it up to readers to estimate the credibility of this report. In other news, inflation is back, as the report states that "Corrugated Cartons is the only commodity reported down in price." What was up? "Airfares; Beef; Chemical Products; Chicken; Crab; Coffee (2); #1 Diesel Fuel (2); #2 Diesel Fuel (3); Fuel; Gasoline; Medical Supplies (2); Paper; Petroleum Based Products; Resin Based Products; Vehicles; and Wire." In other news, factory order missed expectations of a 1.5% increase, coming in at 1.1%. But who cares: it is an election year and the propaganda machine is on in full force.
Here is the "credible" jobs number.

And the full breakdown from the Non-mfg ISM:

What the respondents are saying:
- "Overall business conditions to improve. We continue to outperform previous business cycles." (Information)
- "We are seeing increased contractor bidding and activity in Q1 2012." (Construction)
- "Small business borrowing continues to be slow." (Finance & Insurance)
- "New fiscal year, new budgets — expecting to show an increase in sales in first quarter." (Other Services)
- "Economy continues to show signs of improvement and the company revenue is improving slightly, but is very susceptible to pricing and cost pressures." (Professional, Scientific & Technical Services)
- "There seems to be some stabilization in the economy as well as [in the] supply chain. This seems to be calming inventory and sales positions." (Retail Trade)
- "Business is still stable; however, inflation in food prices is still a problem." (Wholesale Trade)
Commodities Up in Price
Airfares; Beef; Chemical Products; Chicken; Crab; Coffee (2); #1 Diesel Fuel (2); #2 Diesel Fuel (3); Fuel; Gasoline; Medical Supplies (2); Paper; Petroleum Based Products; Resin Based Products; Vehicles; and Wire.
Commodities Down in Price
Corrugated Cartons is the only commodity reported down in price.
Commodities in Short Supply
Crab; #2 Diesel Fuel (2); Fiber Cable; and Pharmaceuticals.
Note: The number of consecutive months the commodity is listed is indicated after each item.
Non-Manufacturing ISM Ignores Banker Layoffs, Surges Past Expectations On Biggest Jump In Employment Index Ever | ZeroHedgeJoin our efforts to Secure America's Borders and End Illegal Immigration by Joining ALIPAC's E-Mail Alerts network (CLICK HERE)
-
02-03-2012, 07:08 PM #5Senior Member
- Join Date
- May 2007
- Location
- South West Florida (Behind friendly lines but still in Occupied Territory)
- Posts
- 117,087
Final Nail In Today's NFP Tragicomedy: Record Surge In Part-Time Workers
Submitted by Tyler Durden on 02/03/2012 10:52 -0500
It appears the record surge in people not in the labor force is not the only outlier in today's data. For the other one we go to the Household Data Survey (Table 9), and specifically the breakdown between Full Time and Part Time Workers (defined as those "who usually work less than 35 hours per week"). We won't spend too much time on it, as it is self-explanatory. In January, the number of Part Time workers rose by 699K, the most ever, from 27,040K to 27,739K, the third highest number in the history of this series. How about Full time jobs? They went from 113,765 to 113,845. An 80K increase. So the epic January number of 141.6 million employed, which rose by 847K at the headline level: only about 10 % of that was full time jobs: surely an indicator of the resurgent US economy... in which employers can't even afford to give their workers full time employee benefits. We can't wait for Mr. Liesman to explain how this number, too, is unadulterated hogwash, and how it too is explained away to confirm economic strength. Incidentally this is not the first time we have discussed the issue of part vs full time workers: for more see here: "Charting America's Transformation To A Part-Time Worker Society, Following 6 Straight Months Of Full Time Job Declines"

Final Nail In Today's NFP Tragicomedy: Record Surge In Part-Time Workers | ZeroHedgeJoin our efforts to Secure America's Borders and End Illegal Immigration by Joining ALIPAC's E-Mail Alerts network (CLICK HERE)
-
02-03-2012, 07:10 PM #6Senior Member
- Join Date
- May 2007
- Location
- South West Florida (Behind friendly lines but still in Occupied Territory)
- Posts
- 117,087
Deconstructing The "Massive Beat" in Employment Data
Courtesy of Lee Adler of the Wall Street Examiner
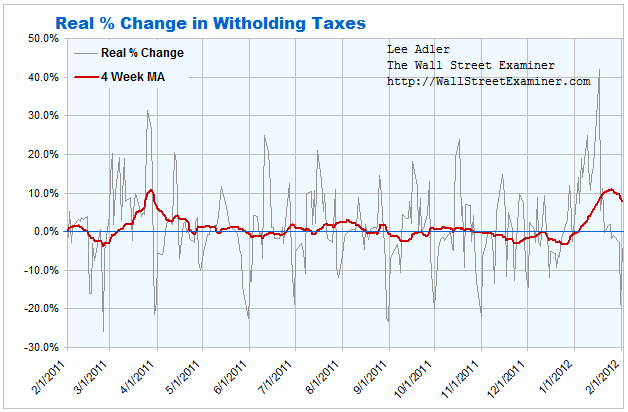
The headlines are blaring of a massive surge in January employment that blew away analysts expectations. Frankly, I find it hard to believe that any analysts would not have expected this "news." The real time Federal Withholding Tax daily data for January, which I dutifully cover each week in the Treasury updates, showed a massive surge beginning in late December. Since everybody didn't get a 10% raise, the analysts might have inferred that more people were working. Whether that's a sustainable trend or not is another question, but for January at least, there should have been no mystery.
I like to look behind the headlines at the real unadjusted, unmassaged, unmanipulated numbers to get some idea of what's really going on. Here's where things get strange. Total reported employment and full time employment plunged in January, as is normal for that month. So the Gummit survey data doesn't square with the tax collections. Had we based our forecast for the headlines (which is the only thing that matters to the market in the short run) on the withholding data, we would have gotten it right, but for the wrong reasons. It's a head scratcher that suggests that the Gummit's employment numbers shouldn't be trusted, which isn't news. What we do know for sure is that there was a gigantic surge in withholding taxes from late December to mid January, and that surge disappeared completely in the last week.
So there's no question that things were fantastic in January, although why and how that happened is a mystery. Last week's action suggests that the good news may not persist in February. We also know that the big beat in the headline numbers was an accident. The seasonal adjustment fudge that the Gummit adds to the mix grossly overstated what the actual survey data showed. Here's a picture. The red line is the actual survey numbers. The blue line is the fake seasonally adjusted number.
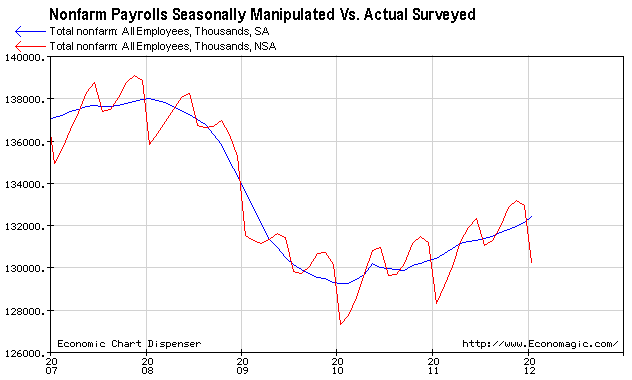
Remember: Red... actual. Blue... fake.
Just so you know your eyes aren't playing tricks on you, let's zoom in to just the past 13 months.
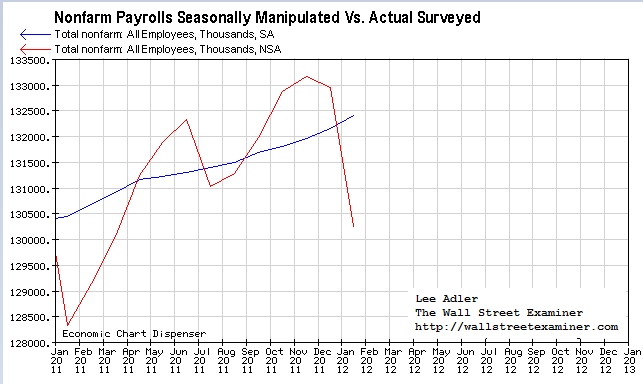
There you have it. The headline, fake, number was up by 243,000, purportedly the biggest increase since 2006. But what's this? The actual survey number showed a decrease of 1.1 million jobs. In the world of seasonally adjusted government data, down can be up.
To be honest though, that's a good number for January. Last year the drop was 1.5 million. This year also compares well with the bubble years of 2005 (-1.07 million) and 2006 (-741,000). So looking at the top line, the bottom line is that it was a good report, just not the blowout positive number that the headlines reported. It wasn't a gain, just a smaller than typical decline.
I like to look at full time employment. There again the seasonal fudging overstated the case. The numbers were pretty good, not blowout. Full time jobs declined by 677,000 in January. That's a lot better than the last 4 years when the country was either in or just emerging from the deepest part of the slump. But it's not as good as 2005-2007, when the drops ranged from only 337,000 to 621,000. This year was better than the worst depression levels and not as good as bubble levels. Does that mean it's just right?
The year to year gain was 1.5 million or just under 1.4%, which was a little less than last year's 1.5%. Is that a good thing?
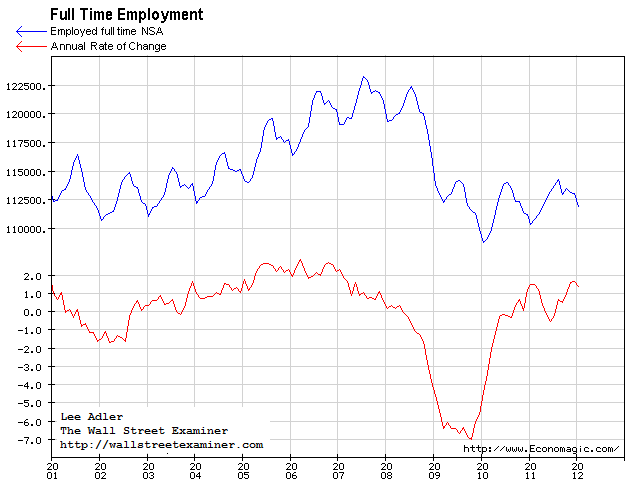
To put this in perspective, the actual survey data says that 111.9 million people had full time jobs in January. That compares with a peak level of 119.3 million in January 2008. They call that a "recovery?"
I wonder whether these numbers can be trusted at all, given the huge surge in withholding taxes in January. From that perspective, the BLS data would seem to understate the gain. But was the gain in taxes really about more jobs, or something else? What was behind that surge in tax collections is a mystery. Apparently, it may have had more to do with bonuses and sales commissions than a big increase in the number of jobs.
There may be a hint of that in the average weekly earnings report which showed a jump of 1.8% between December and January. Apparently some people got big paychecks during the period. I wouldn't attribute it to a sudden increase in inflation, at least not yet.
In the end, it's hard to give any of these reports much credence. The blowout headline numbers are misleading, although the tax withholding data showed that some people clearly enjoyed a windfall from late December through the latter part of January. But then that disappeared last week. The chances are that these employment numbers will be heavily revised, and if last week's tax data is indicative of what's ahead this month, the "good news" won't be sustained.
Given the confusion inherent in these numbers, the proof of whether there's any real improvement in the employment trend may not come until this summer when peak employment levels are normally reached. In 2009, 2010, and 2011, peak full time employment stalled at about the same level each July. This year and last year the seasonal lows have trended upward. So if the economy really is growing, given the running head start off the lows I would expect full time employment to leap past last year's highs in May or June. If that does not happen, then we have gained nothing. The initial indications will come in the rate of growth in February and March. Those are numbers to watch. If the growth rate holds up, then the economy is growing, but if those growth rates slow, then we're probably running in quicksand.
Meanwhile, the government's own survey data show that 7.4 million fewer people have full time jobs today than was the case 4 years ago. Those 7 million jobs were the fake jobs spawned by the housing and credit bubbles. Those jobs were vaporized when the bubble economy collapsed. They are NEVER coming back. The "new normal" is just the old normal without the added froth. What we are left with is the bitter reality of fewer people carrying the tax load and more people needing government assistance. We have yet to see any real proof that the trends are improving enough to ameliorate those burdens on the economy.
Get regular updates on the US housing market, and stay up to date with the machinations of the Fed, Treasury, Primary Dealers and foreign central banks in the US market, in the Fed Report in the Professional Edition, Money Liquidity, and Real Estate Package. Try it risk free for 30 days. Get the research and analysis you need to understand these critical forces. Click this link to try WSE’s Professional Edition risk free for 30 days!
Deconstructing The "Massive Beat" in Employment Data | ZeroHedgeJoin our efforts to Secure America's Borders and End Illegal Immigration by Joining ALIPAC's E-Mail Alerts network (CLICK HERE)
-
02-03-2012, 07:14 PM #7Senior Member
- Join Date
- May 2007
- Location
- South West Florida (Behind friendly lines but still in Occupied Territory)
- Posts
- 117,087
TrimTabs Explains Why Today's "Very, Very Suspicious" NFP Number Is Really Down 2.9 Million In Past 2 Months
Submitted by Tyler Durden on 02/03/2012 15:01 -0500
We have examined the nuance of the euphoric jobs data this morning from every angle and by now there should be plenty of 'information' for investors to make their own minds up on its credibility. However, the avuncular CEO of TrimTabs, who despite channeling Lewis Black lately, likely knows this data a little better than the average Jim on the street having collected tax witholdings data for the past 14 years, is modestly apoplectic at the adjustments. In one of his more colorful episodes, and rightfully so, Charles Biderman notes that "Either there is something massively changed in the income tax collection world, or there is something very, very suspicious about todays BLS hugely positive number," adding, "Actual jobs, not seasonally adjusted, are down 2.9 million over the past two months. It is only after seasonal adjustments made at the sole discretion of the Bureau of Labor Statistics economists that 2.9 million fewer jobs gets translated into 446,000 new seasonally adjusted jobs." A 3.3 million "adjustment" solely at the discretion of the BLS? And this from the agency that just admitted it was underestimating the so very critical labor participation rate over the past year? Finally, Biderman wonders whether the BLS is being pressured during an election year to paint an overly optimistic picture by President Obamas administration in light of these 'real unadjusted job change' facts. Frankly, in light of recent discoveries about the other "impartial" organization, the CBO, we don't think there is any need to wonder at all.
TrimTabs believes the job growth picture lies somewhere in between TrimTabs estimate and the BLS. Looking forward to February and March, we will have a much cleaner picture of job growth as we move away from the effects of tax law changes, bonus season, and enormous seasonal adjustments.
A comparison of TrimTabs real-time withholding tax based employment results versus the BLS preliminary and revised results from January 2011 through January 2012 are summarized in the following table:

and from details from his blog (for the press corps to perhaps dig a little deeper):
Finally, and this is a repeat of what we said prior using SIFMA data (so originating at the US banksthemsleves), for the US unemployment to be declining, Federal tax withholdings have to be rising: there is no way around it! Instead, as the chart below shows, trailing quarterly collections have just turned negative.
Obviously I am quite suspicious of the numbers that I see in todays BLS press release. Remember most financial journalists and even stock market strategists do nothing more than rewrite government press releases. So do not expect very few others to question the good news.
For those of you who care, look at Table B-1, Total Nonfarm Employment in todays BLS press release. Start with the non seasonally adjusted table that shows that in November 2011, there were 133.172 million actual jobs. Actual jobs dropped by 220,000 jobs in December and actual jobs dropped an additional 2.7 million in January. Only as a result of unknown seasonal adjustments, could the BLS report 243,000 new hires in January.
Yes, the labor market contracts during the winter and expands in the spring and summer. Could this number be manipulated? Of course it could. Is it? I dont know. Am I the only suspicious soul out here? Hope not. Certainly feels lonely right now.

Q.E.D.
http://www.zerohedge.com/news/trimta...on-past-2-mont
Join our efforts to Secure America's Borders and End Illegal Immigration by Joining ALIPAC's E-Mail Alerts network (CLICK HERE)
-
02-03-2012, 07:15 PM #8Senior Member
- Join Date
- May 2007
- Location
- South West Florida (Behind friendly lines but still in Occupied Territory)
- Posts
- 117,087
Listen To Obama Explain Why The US Labor Force Declined By 1.2 Million And Why Temp Jobs Surged By A Record
Submitted by Tyler Durden on 02/03/2012 11:32 -0500
Video at the page link
Actually, now that we think about it, he may not touch on those specific issues.
Listen To Obama Explain Why The US Labor Force Declined By 1.2 Million And Why Temp Jobs Surged By A Record | ZeroHedgeJoin our efforts to Secure America's Borders and End Illegal Immigration by Joining ALIPAC's E-Mail Alerts network (CLICK HERE)
-
02-05-2012, 10:43 AM #9Super Moderator

- Join Date
- Apr 2006
- Location
- North Carolina
- Posts
- 8,322
I was listening to Rush talk about this on Friday. This is a small part of what he said:
Unbelievable that the number of jobs can drop by 2.5 million, yet, according to the govt, the unemployment rate goes down! They take us for idiots!! Makes me mad but what the heck can we do about it, besides vote Obama out, but I don't think it's just him. The whole govt is corrupt these days!!In December, the number of jobs in this country -- this the from the Bureau of Labor Statistics' own table today, they do the unemployment numbers. The number of jobs in December, 132,952,000. The number of jobs in January, 130,400... so there are actually two and half million fewer people working in January than there were in December. But those are raw numbers. That's before the seasonal adjustment take us place. Table B-1 is where this is from, from the BLS numbers. Now, I don't pretend to understand the seasonal adjustment. I'm not taking issue with it. It seems like the statistical formula that's used, given what they're trying to accomplish, makes sense. All I know is that the raw number is down two and a half million jobs. I'm not making it up and it's not in a Drive-By story and it's not some Looney Toon blog. It's the government. The Bureau of Labor Statistics.
Thanks for posting all this great info, ABS7!Join our efforts to Secure America's Borders and End Illegal Immigration by Joining ALIPAC's E-Mail Alerts network (CLICK HERE)


 Reply With Quote

Black Pigeon Speaks | How Britain Was Trained to Accept Its Own...
07-08-2026, 10:05 PM in General Discussion