

Results 1 to 1 of 1
Thread Information
Users Browsing this Thread
There are currently 1 users browsing this thread. (0 members and 1 guests)
 LinkBack URL
 About LinkBacks
-
05-10-2010, 01:28 AM #1Senior Member


- Join Date
- May 2007
- Location
- South West Florida (Behind friendly lines but still in Occupied Territory)
- Posts
- 117,696
Stock Market Investor Sentiment: The Great Unwind
Stock Market Investor Sentiment: The Great Unwind
Stock-Markets / Stock Market Sentiment
May 09, 2010 - 05:02 AM
By: Guy_Lerner
When you look at investor sentiment for the past week, you must understand that the majority of data was collected and disseminated prior to Thursday's downdraft. While the data may seem stale and not reflective of the end of week events, it should be appreciated how many investors were wrong on this market. We weren't just seeing excessive bullish sentiment prior to this week, we were seeing extreme and excessive bullish sentiment. For example, in the Investors Intelligence data, there were 3 times as many bulls as bears, a reading last seen in December, 2009 and October, 2007.
The Rydex market timers had twice as many assets in bullish funds versus bearish funds, which was the highest value since the December, 2004 top. The point is this: these kinds of extremes are going to take time to unwind. Sentiment remains bullish despite this week's drubbing for stocks. I doubt investors are hopeful or acting like deer caught in the headlights. If they are, a bounce should bring further selling. More likely, there are just a lot bulls hoping to get to the exits or wishing they had sold last Monday. The next great buying opportunity will be when the "dumb money" turns bearish, and the only way to make this happen is for prices to continue lower. This appears to be several weeks away (at least) as the excessive and extreme sentiment seen over the past 8 weeks is unwound.
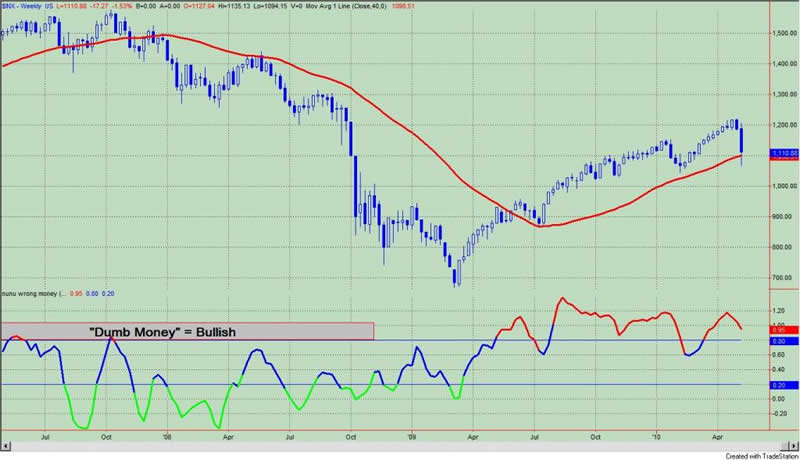
The "Dumb Money" indicator (see figure 1) looks for extremes in the data from 4 different groups of investors who historically have been wrong on the market: 1) Investor Intelligence; 2) Market Vane; 3) American Association of Individual Investors; and 4) the put call ratio. The "Dumb Money" indicator is bullish to an extreme degree. If you think this is good for higher prices, then read the article entitled, "This Is For All You Bull Market Geniuses".
Figure 1. "Dumb Money" Indicator/ weekly
The "Smart Money" indicator is shown in figure 2. The "smart money indicator is a composite of the following data: 1) public to specialist short ratio; 2) specialist short to total short ratio; 3) SP100 option traders. The "Smart Money" indicator is bearish for the second straight week.
Figure 2. "Smart Money" Indicator/ weekly
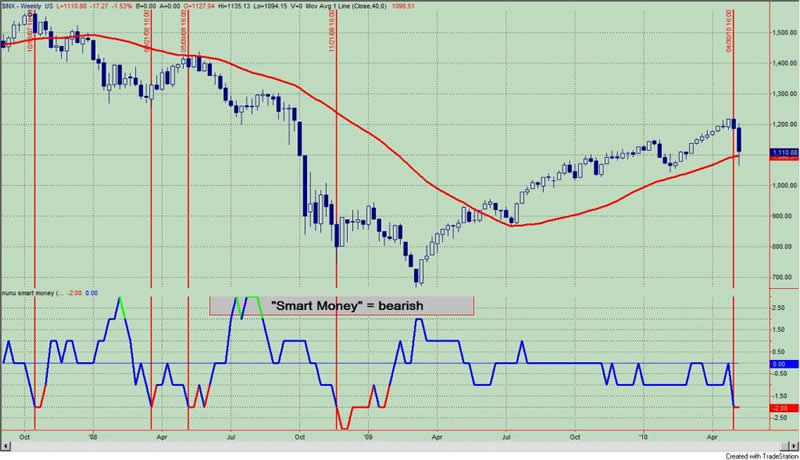
Figure 3 is a weekly chart of the S&P500 with the InsiderScore "entire market" value in the lower panel. From the InsiderScore weekly report we get the following: "The fact that so many buyers did so little to offset their selling peers is a sign that conviction lays with those taking money off the table....the Weekly Score for the Entire Market fell dramatically, settling at its eighth-worse level over the past three years."
Figure 3. InsiderScore/ weekly "entire market" value
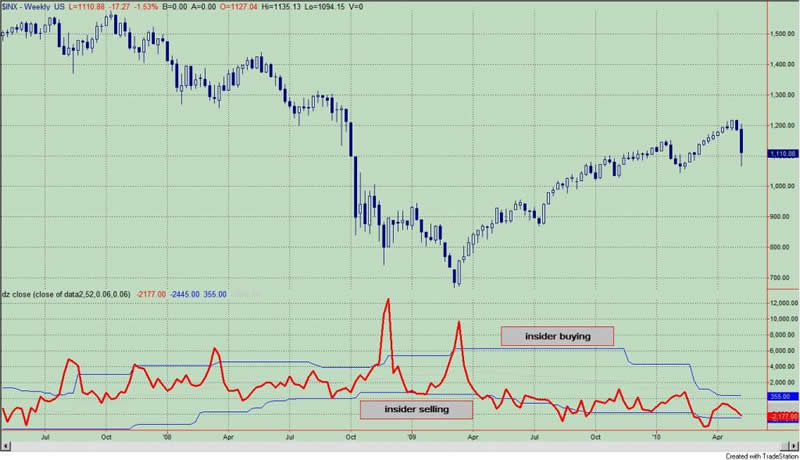
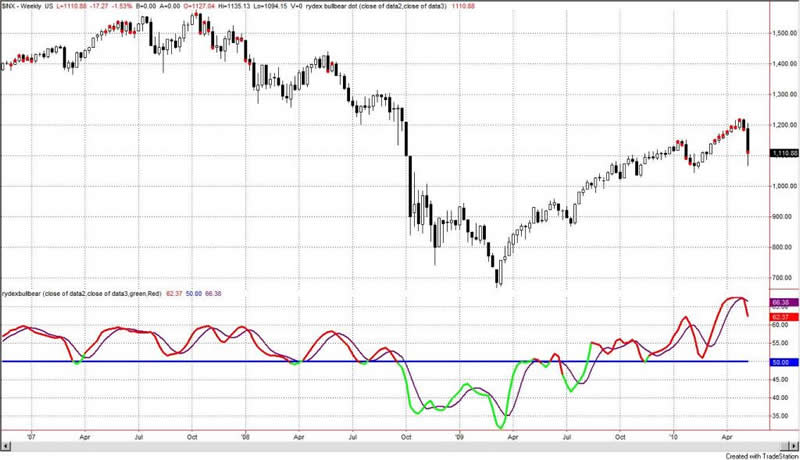
Figure 4 is a weekly chart of the S&P500. The indicator in the lower panel measures all the assets in the Rydex bullish oriented equity funds divided by the sum of assets in the bullish oriented equity funds plus the assets in the bearish oriented equity funds. When the indicator is green, the value is low and there is fear in the market; this is where market bottoms are forged. When the indicator is red, there is complacency in the market. There are too many bulls and this is when market advances stall.
Currently, the value of the indicator is 62.37%. Values greater than 58% (arbitrarily chosen) are associated with market tops, and the red dots over the price bars indicate such.
Figure 4. Rydex Total Bull v. Total Bear/ weekly
Shorter term Rydex measures continue to suggest excessive bullishness. This data, which has proved to be very actionable, is available as Premium Content. This service should help you improve your market timing.
By Guy Lerner
http://thetechnicaltakedotcom.blogspot.com/
http://www.marketoracle.co.uk/Article19324.htmlJoin our efforts to Secure America's Borders and End Illegal Immigration by Joining ALIPAC's E-Mail Alerts network (CLICK HERE)


 Reply With Quote

San Diego Sector of Southern Border Reaches Top Spot for Illegal...
05-11-2024, 02:51 PM in illegal immigration News Stories & Reports