

Results 1 to 1 of 1
Thread Information
Users Browsing this Thread
There are currently 1 users browsing this thread. (0 members and 1 guests)
 LinkBack URL
 About LinkBacks
Threaded View


-
08-22-2010, 11:46 PM #1Senior Member


- Join Date
- May 2007
- Location
- South West Florida (Behind friendly lines but still in Occupied Territory)
- Posts
- 117,696
Third Hinderburg Omen Signals Stock Market Crash
Third Hinderburg Omen Signals Stock Market Crash
Stock-Markets / Financial Markets 2010
Aug 22, 2010 - 07:51 PM
By: Anthony_Cherniawski
FDIC Friday back on the job.- The FDIC Failed Bank List announced eight new bank closures this week. My count suggests 118 on August 20th. ShoreBank Corp., the Chicago lender operating under a Federal Deposit Insurance Corp. cease-and- desist order for 13 months, will be shut and most of its assets will be bought by Urban Partnership Bank, two people with direct knowledge of the matter said.
European Stocks Retreat for Second Consecutive Week Amid Slowdown Concern
European stocks posted the biggest weekly decline in seven weeks as economic reports from the U.S. and Japan heightened concern that the global economic recovery may be stalling. The benchmark Stoxx Europe 600 Index fell 1.3 percent to 252.15 this past week, the biggest drop since July 2, as reports showed U.S. jobless-benefit claims climbed to the highest level in nine months and Japanâs economy grew at the slowest pace in three quarters.
Second Hindenburg Omen Confirmation In As Many Days, Third H.O. Event In One Week
(ZeroHedge) http://www.zerohedge.com/article/second ... t-one-week Longs may be forgiven if they are sweating their long positions over the weekend: not only did we just have a second, and far more solid Hindenburg Omen confirmation today, with 82 new highs, and 94 new lows, http://online.wsj.com/mdc/public/page/2 ... highs.html but the Saturday is the day when Iran launches its nuclear reactor, and everyone will be very jumpy regarding any piece of news out of the middle east. As for the H.O., the more validations we receive⦠the greater the possibility for a meltdown. Furthermore, with implied correlation at record levels ( JCJ at around 78 ), any potential crash will be like never before, as virtually all stocks now go up or down as one, more so than ever before.
The VIX broke out from below its 10-week M.A.
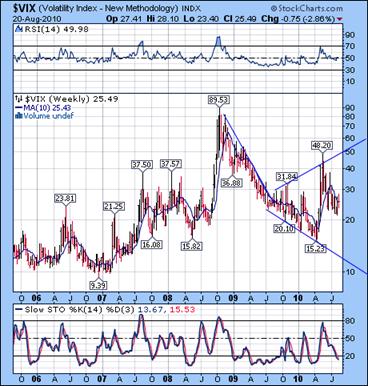
--The VIX broke above its 10-week moving average and made a new high for the month this week. It had a successful reversal pattern and the Model target is now 37.50.
The NYSE (weekly) Hi-Lo index fell this week to -18, down 102 points for the week.
SPX is positioned to finish its Head & Shoulders Pattern.
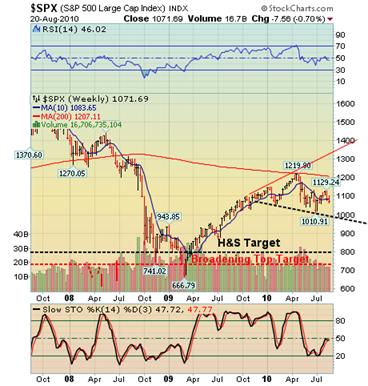
-- The decline during options week in SPX may have been a bit of a surprise for traders. The traditional spike rally into the close of options was noticeably absent. In addition, the largest decline occurred on Thursday, a POMO day. http://www.newyorkfed.org/markets/pomo/ ... /index.cfm A survey of 60 POMO days in 2009 showed that the average daily gain through the year was .20%, while the gain was .25% on a POMO day. It appears that POMO days may have been front-run by traders, since the gain on the day before was .29%, but overall, the POMO appears to be more of an exercise in the use of the bully pulpit more than anything else. This time the bully pulpit didnât seem to work at all.
The NDX remained below tis 10-week moving average.
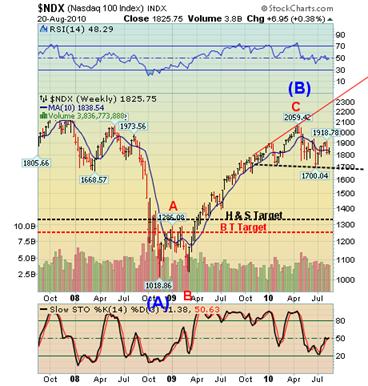
--The NDX remained below its 10-week moving average this week. The upcoming third wave decline has an average target of 1672, which activates the Head & Shoulders pattern. Since there are two degrees of a third wave, the likelihood of an extension is even greater.
Two weeks ago I had mentioned that, 50 may be the top for the momentum indicators during most of a wave 3 or C decline. You may observe that is almost precisely what happened this week.
Gold takes one more stab at the trendline.
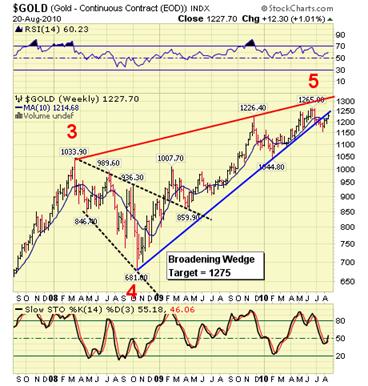
-- Gold may have used some of the POMO money to take another stab at its two-year trendline. On Thursday it made its high for the week just as the POMO liquidity made its way into the markets. A reversal is not yet evident. The next Trading Cycle low is due in mid-September.
The target for gold is 1000-1050.
$WTIC broke below support.
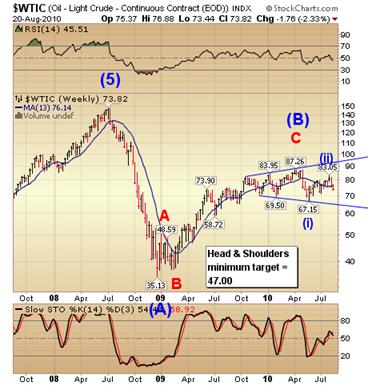
-- $WTIC broke below support and appears to be heading for a challenge of its Head & Shoulders neckline. Elliott Wave relationships corroborate the Head & Shoulders target shown on the chart. The average target is 50.87, before extensions.
The Federal Reserve Bank of Philadelphiaâs general economic index dropped to the lowest reading since July 2009. Total U.S. inventories of crude and oil products reached the highest in at least 20 years, Energy Department data showed earlier this week.
The Bank Index skirmishes with its neckline.
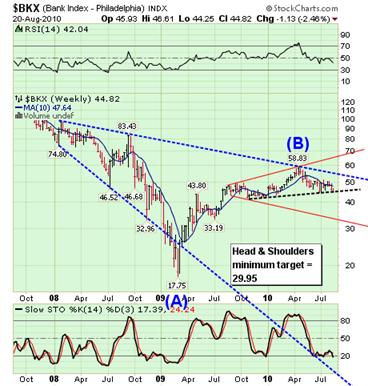
--The $BKX has been challenging its neckline this week. It briefly went below its prior neckline low at 44.39 on Friday before closing just above it. Piercing the neckline brings it in line to challenge its Orthodox Broadening Top formation, which is near 33.00.
The multiple bearis patterns suggest the potential of a runaway train-wreck in the banking index. The Cycles suggest that it has already begun and has another two months to run.
The Shanghai Index made a new high.
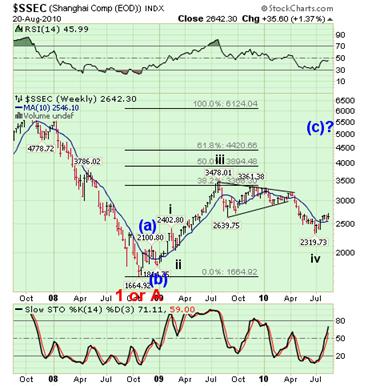
--The Shanghai Index made a new high this week that may qualify as a completed impulse. The cycles suggest the next weekly move in $SSEC may be a decline. Should it remain above 2319.73 by the end of August, we may see another rally to match its wave iii in size. $SSEC did not quite reach its mid-Cycle Support/Resistance at 2750 so there may be some bullishness left before it pulls back. This index may be the recipient of much of the money flowing out of equities in the U.S., Japan and Europe.
$USB throws over its wedge.
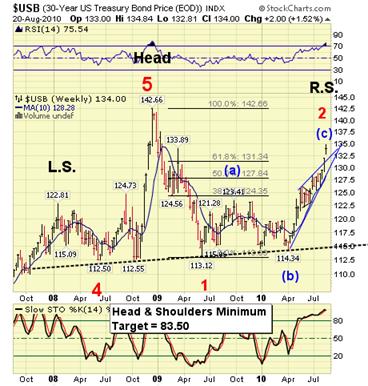
-- $USB had a throw-over above its wedge this week, which is an exhaustion move. The POMO had some influence, since nearly the entire gain for the week occurred (after 10:00 am) on Thursday. Monday is a pivot day for bonds, which makes an ideal day for a reversal. Once the reversal is in, the next move will be to a Trading Cycle low in mid- September. Bullish sentiment is very high in Treasuries. This may catch a lot of traders off guard.
$USD challenges its 10-week moving average.
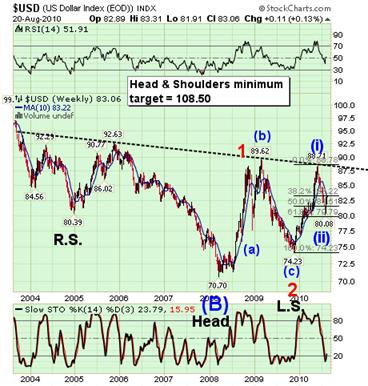
-- $USD challenged its 10-week moving average at 83.22 before closing below it. The next Cycle Pivot is due on Monday. I donât expect $USD to remain below resistance after that. EW relationships suggest that this rally should go to 103.54, before extensions. If it follows its normal cycle pattern, we may see its top near election day.
I hope you all have a wonderful weekend!
Regards, Tony
Anthony M. Cherniawski
http://www.marketoracle.co.uk/Article22106.htmlJoin our efforts to Secure America's Borders and End Illegal Immigration by Joining ALIPAC's E-Mail Alerts network (CLICK HERE)


 Reply With Quote

DHS says 'privacy' of migrants on terrorist watchlist is greater...
05-17-2024, 09:42 PM in illegal immigration News Stories & Reports