

Results 1 to 1 of 1
Thread Information
Users Browsing this Thread
There are currently 1 users browsing this thread. (0 members and 1 guests)
 LinkBack URL
 About LinkBacks
-
01-25-2011, 06:00 PM #1Senior Member


- Join Date
- May 2007
- Location
- South West Florida (Behind friendly lines but still in Occupied Territory)
- Posts
- 117,087
U.S. Housing Market into the 2020's
U.S. Housing Market into the 2020's
Housing-Market / US Housing
Jan 25, 2011 - 01:48 AM
By: Tony_Caldaro
From time to time we have been reviewing the historical housing market index, provided by Case-Shiller, in an attempt to identify historical patterns. Since the historical index is not provided in nominal terms (inflation included), but real terms (inflation excluded), this has been a difficult task. Everything we track, in OEW terms, is quoted in nominal prices. After several attempts over the past few years we feel we have identified enough historical patterns to offer an educated projection for the US housing market going forward. We present the history of US housing prices using a chart courtesy of Steve Barry/Barry Ritholtz. This chart displays the past 120 years of US existing home prices in real terms, with a dashed line forecast by Robert Shiller of Case-Shiller.
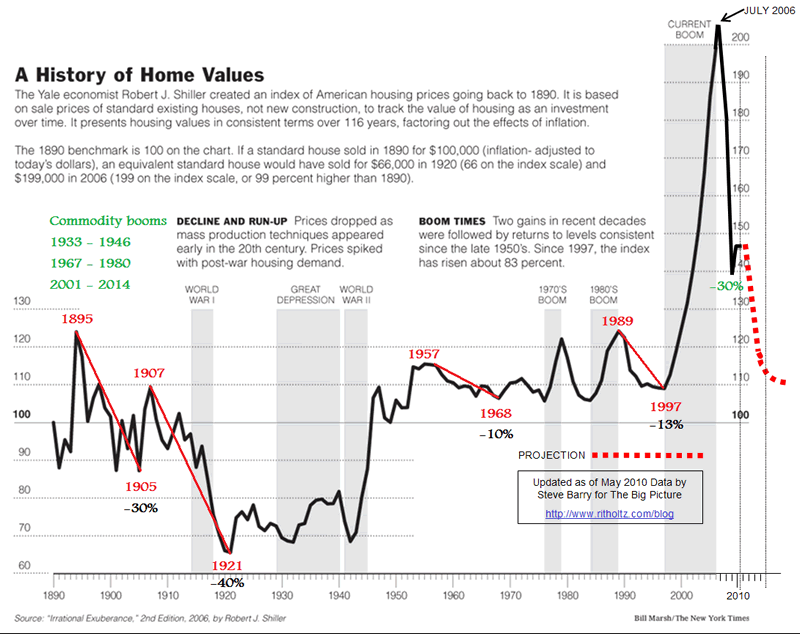
The first observation we made is that there have only been four previous periods when housing prices declined for a decade: 1895-1905, 1907-1921, 1957-1968 and 1989-1997. We count the major decline from 1895-1921 as two events for two reasons. The rally from 1905-1907 was over 25% and the second decline was due to mass production building techniques which lowered the building costs of new houses substantially. Keep in mind this chart is in real dollars, not nominal dollars.
The first two of these decade long declines were steep: -30% and -40%. The second two, after mass production and manufacturing led to the economic expansion of the US, were quite minor: -10% and -13%. These minor corrections should be, and were, considered the norm in modern times. The next striking observation is that US housing dropped 30% between 2006 -2009/10, just four years. This type of quick and steep straight line decline had previously occurred only once in the entire 120 years: the 30% decline between 1916-1920. Historically this type of major event, which is similar to a stock market crash, eventually leads to a important low within a few years and/or a long base building consolidation period around the crash lows. Notice after the recent 30% straight line decline housing prices did get a small bounce.
We also identifed the typical relationship of housing prices to the commodity bull market cycle. Naturally, as raw materials rise in price the building costs of new homes rise in price as well. This puts upward price pressure, regardles of inflation, on existing home prices.
During the 1933-1946 commodity boom: home prices bottomed in 1932, rose about 15%, made a second bottom in 1942, and then started a sustained rise in price. During the 1967-1980 commodity boom: home prices bottomed in 1968, rose about 5%, made a second bottom in 1977, and then had a 15% rally into 1979. Notice after both commodity booms ended there was a decline in prices (1947-1949 and 1979-1985), and then another rally to higher highs (1949-1957 and 1985-1989).
This commodity boom (2001-2014) has been quite different. While the two previous bull markets in housing were price/demand driven. The recent bull market in housing was credit/demand driven. When prices became too high during a price/demand cycle, demand slackened, and prices corrected 10% to 13%. When the poor credit home owners, during the recent credit/demand cycle started to default because of interest rate resets, foreclosures started to increase total housing supply. This put downward pressure on housing prices, and they began to decline, creating even more foreclosure/supply. As these interest rate resets continued the foreclosures eventually flooded the housing market with supply. Then housing prices began to plummet and demand decreased substantially. So instead of a normal 10% to 13% decline over a number of years, we experienced a major 30% decline in a matter of just 3 â 4 years. Had credit not been so readily available housing prices would have risen normally, like they have during the past two commodity booms. With easy credit for normally unqualified applicants, future demand was front loaded into the present creating a credit/demand default cycle and a housing crash. Every bear market, however, is followed by a bull market.
After we combine all these price observations we still need to review the fundamentals. Banks are still holding, possibly, two years of supply in existing/future foreclosures. New homes are still being built and normal seasonal supply cycles are still ongoing. Demand remains on the low side with 9% unemployment. The present economy is not encouraging either small businesses, corporations, nor banks to return to normal operations. Thus unemployment may remain high for a number of years. The consumer has only recently become a net saver, after decades of net consumption with easy credit. And, banks are demanding larger deposits and higher credit ratings from potential buyers before even considering offering a mortgage. Also, government incentives have had a limiting effect. Yet, the FED has aided the housing industry by keeping long term rates quite low. This is generally helping qualified home buyers to secure more property per income dollar than they would obtain otherwise. After considering the fundamental and technical factors we can now make some assumptions.
We anticipate that the housing market will remain under pressure from 2006 â 2015 or so. Typically these types of declines take about one decade to complete. On the downside we are not expecting much more or a decline. Possibly into the 130â²s area over the next few years, with an outside chance of hitting the 1989 high around 125. This would represent a total decline between 33% and 38%. Housing has already declined 30%. Once the bottom occurs we would expect a multi-year rally and then a retest of the lows, somewhat similar to the 1932-1942 and 1975-1985 periods. The second bottom should occur by the mid-2020â²s. Then a new bull market in US housing should get underway.
Naturally, regional areas will vary from the overall average both up and down. The areas with strong employment growth will recover faster than those with increasing or stable unemployment. Also, the quality of jobs available will impact the housing recovery in these regional areas as well. Generally home prices do best in areas with high and growing employment needs in quality jobs. The Dallas FED region currently leads the nation in this area. As a result we are likely to see a housing market recovery first in Texas and its surrounding areas. Nationally, a bottom in 2015, a bounce into 2020, then a retest of the low in 2025. Then a new bull market in housing in real prices nationwide. Land at bargain basement prices is always a good deal. Weâll update this housing report when something of interest unfolds. Happy house hunting.
CHARTS: http://stockcharts.com/def/servlet/Favo ... =ID1606987
http://caldaroew.spaces.live.com
http://www.marketoracle.co.uk/Article25833.htmlJoin our efforts to Secure America's Borders and End Illegal Immigration by Joining ALIPAC's E-Mail Alerts network (CLICK HERE)


 Reply With Quote

Reuters: China Puts Freeze on ICEs Deportations of Chinese...
05-06-2026, 06:29 AM in illegal immigration News Stories & Reports