

Results 1 to 3 of 3
Thread Information
Users Browsing this Thread
There are currently 1 users browsing this thread. (0 members and 1 guests)
 LinkBack URL
 About LinkBacks
-
04-30-2013, 09:18 PM #1Senior Member


- Join Date
- May 2007
- Location
- South West Florida (Behind friendly lines but still in Occupied Territory)
- Posts
- 117,696
US Homeownership Rate Drops To 1995 Levels
US Homeownership Rate Drops To 1995 Levels
 Submitted by Tyler Durden on 04/30/2013 12:48 -0400
When it comes to the US housing market there appear to be three groups of people: those who who have either unlimited cash and/or access to credit, and like the most rabid of bubble-chasing speculators, are perfectly happy to engage in a game of Flip That House for a short-term profit pending the discovery of a greater fool (often times converting the house into rental properties as numerous hedge funds have been doing on cost-free basis courtesy of the government's REO-To-Rent program) - they are the vast minority of speculators; then there are those who currently rent and are opportunistically looking at home prices, willing to dip their toe at the right price - these too are few and far between and mostly represent a function of the natural growth of the US household offset by the availability of jobs; and then there is everyone else. Sadly, it is the "everyone else" that is the vast majority of the US population.
It is this "everyone else" that is once again being forced out of housing due to both the ramping bubble in housing prices making housing affordable primarily to those who buy with the intention of flipping, and due to the lack of available credit to those who actually need it (see sad state of commercial bank loans in the US).
Finally, it is this "everyone else" who comprises the bulk of those who have been kicked out of the American Dream, whose core pillar has always been owning your own home (with or without a massive mortgage attached), not renting.
As the US Census Bureau reported earlier today, the US homeownership rates in the first quarter of 2013 dropped by another 0.4% to a fresh 18 years low, or 65% - the lowest since 1995!

That this progressive, ongoing decline in ownership is taking place despite allegedly record home affordability is without doubt the most troubling feature of the economic "recovery" which has forced ever more Americans to shift away from owning and into renting, as can be seen by the next two charts showing the median asking rent and sale prices for vacant rent units and for sale units. While home prices have a long way to go still countrywide (excluding the occasional regional bubble market such as LA and NY), rents are already at record highs, which explains why it is every hedge fund's dream to become a landlord.

However, it is only a matter of time before zero-cost subsidized rental pass thru units owned by hedge funds who can therefore keep the rental asking price as high as they wish, forces out more and more Americans out of the Adjusted American Dream, where renting is the new buying, and leads to ever more people living in the streets.
Although, we are confident, it will be merely a matter of time before this, or some other administration, simply unleashes a "street living tax" - after all, "it is only fair" to apply austerity to hobos next. Because it has worked so well with the billionaires and trillionaires...
http://www.zerohedge.com/news/2013-0...ps-1995-levelsJoin our efforts to Secure America's Borders and End Illegal Immigration by Joining ALIPAC's E-Mail Alerts network (CLICK HERE)
-
04-30-2013, 09:22 PM #2Senior Member
- Join Date
- May 2007
- Location
- South West Florida (Behind friendly lines but still in Occupied Territory)
- Posts
- 117,696
Guest Post: Bubble Symmetry And Housing
Submitted by Tyler Durden on 04/30/2013 15:40 -0400
Submitted by Charles Hugh-Smith of OfTwoMinds blog,
If bubbles eventually revert to their starting level, Phase 3--capitulation and a return to pre-bubble prices--still lies ahead for the housing market.
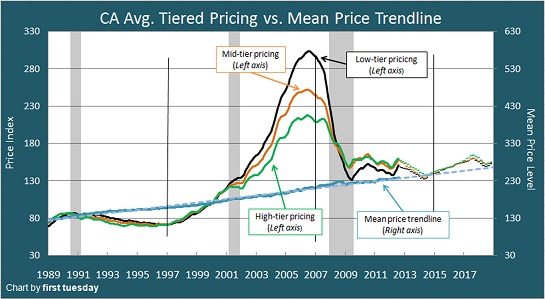
Way back in 2006 at the height of the housing bubble, I prepared this chart proposing the housing bubble might exhibit symmetry, i.e. the decline would mirror the rise. I also proposed that the decline would be characterized by phase shifts that corresponded to the decay of whatever reason was being given for the "recovery" in housing, for example, "this must be the bottom."
Let's compare this idealized bubble symmetry with a chart from reality: housing in the bubblicious Los Angeles market.
Here's another look at the L.A. market as measured by Standard & Poors:
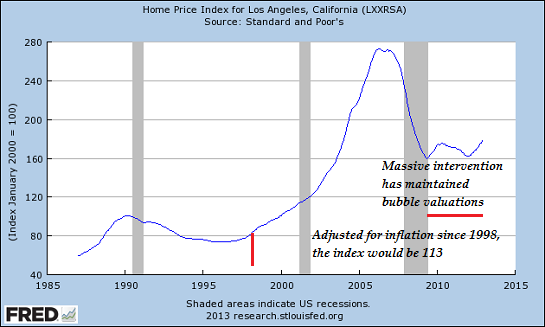
Hmm, what would have happened if the Federal Reserve hadn't dumped trillions of dollars into the mortgage market, and the Federal housing agencies hadn't subsidized mortgages and housing with 3% down payments and tax credits?
Perhaps all the trillions of dollars of intervention has accomplished is extend Phase 2. Central bank and state manipulation distorted the symmetry of housing's decline, but did they stave off Phase 3 permanently?
If bubbles eventually revert to their starting level, Phase 3--capitulation and a return to pre-bubble prices--still lies ahead.
http://www.zerohedge.com/news/2013-0...ry-and-housing
Join our efforts to Secure America's Borders and End Illegal Immigration by Joining ALIPAC's E-Mail Alerts network (CLICK HERE)
-
04-30-2013, 09:25 PM #3Senior Member
- Join Date
- May 2007
- Location
- South West Florida (Behind friendly lines but still in Occupied Territory)
- Posts
- 117,696
Case-Shiller Composite Rises 0.3% In February, Back To September 2010 Levels
Submitted by Tyler Durden on 04/30/2013 09:27 -0400
If there is one admirable thing about the Case Shiller Home Price Index report (which sadly shows data for February so a nearly three month delay) is that even according to its authors, it is the Non-Seasonally Adjusted number that is representative of what is going on in housing. And, as the chart below shows, very little is going on as the broader price level continues to undulate in a very tight range with little real moves to the up or downside.

Posting a level of 146.57 for the broad Composite 20 index, there was a 0.3% increase sequentially, and a flatline in prices in the past 6 months, as the index has not budged from its level since September. Of course, that does not mean there are not bubble pockets in the US. As noted yesterday, Los Angeles is quite frothy, posting a 1% increase in February (a number which will since surge if Altos' data is correct), second only to Phoenix (at 1.1%). Alternatively, eight MSA saw a decline in February, with weaker markets in Denver, DC, Chicago, Detroit, Minneapolis, Charlotte, Cleveland and Seattle. But at least the old stronghold "bubble" locations: California, Nevada and Florida are back to doing what they do best. On a year over year basis, the Composite 20% jumped by 9.3% due to a very weak market in early 2012, which was the main reason for the Fed to eventually activate QEternity.
From the report:
Sequential change: mixed bag.
Home prices continue to show solid increases across all 20 cities, says David M. Blitzer, Chairman of the Index Committee at S&P Dow Jones Indices. The 10- and 20-City Composites recorded their highest annual growth rates since May 2006; seasonally adjusted monthly data show all 20 cities saw higher prices for two months in a row the last time that happened was in early 2005.
Phoenix, San Francisco, Las Vegas and Atlanta were the four cities with the highest year-over-year price increases. Atlanta recovered from a wave of foreclosures in 2012 while the other three were among the hardest hit in the housing collapse. At the other end of the rankings, three older cities New York, Boston and Chicago saw the smallest year-over-year price improvements.
Despite some recent mixed economic reports for March, housing continues to be one of the brighter spots in the economy. The 2013 first quarter GDP report shows that residential investment accelerated from the 2012 fourth quarter and made a positive contribution to growth. One open question is the mix of single family and apartments; housing starts data show a larger than usual share is apartments.
In February 2013, the number of cities that posted positive monthly changes increased; Boston, Dallas, New York, Portland and San Diego are now among the MSAs posting month-over-month gains.
Even though eight MSAs posted monthly declines, all twenty cities showed increases when compared to their February 2012 levels. Atlanta, Detroit, Las Vegas, Los Angeles, Miami, Minneapolis, Phoenix, San Diego, San Francisco and Tampa were the ten MSAs that continued to report double-digit year-over-year gains. San Diego and Tampa recorded their first months of double-digit annual increases of just over 10.0%.

http://www.zerohedge.com/news/2013-0...er-2010-levelsJoin our efforts to Secure America's Borders and End Illegal Immigration by Joining ALIPAC's E-Mail Alerts network (CLICK HERE)


 Reply With Quote


Listen to William Gheen on Rense Apr 24, 2024 talking Invasion...
04-25-2024, 02:03 PM in ALIPAC In The News