

Results 1 to 2 of 2
Thread Information
Users Browsing this Thread
There are currently 1 users browsing this thread. (0 members and 1 guests)
 LinkBack URL
 About LinkBacks
-
10-03-2010, 06:11 PM #1Senior Member


- Join Date
- May 2007
- Location
- South West Florida (Behind friendly lines but still in Occupied Territory)
- Posts
- 117,696
In Gold We Trust, The Fed Canât Print It, $1500 Forecast T
In Gold We Trust, The Fed Canât Print It, $1500 Forecast Target
Commodities / Gold and Silver 2010
Oct 03, 2010 - 06:25 AM
By: Przemyslaw_Radomski
We continuously ask friends to send links to stories on gold they encounter in their daily excursions on the Internet. These are people who do not follow the financial markets. We want to get an indication of how many gold stories ordinary folks are bumping into. We were away for a week and upon returning we had almost 200 e-mails in the inbox among them many links to gold stories sent by our diligent friends. Even before zealously tackling the charts and tools, this made us think that the recent run up is not the start of a big runaway rally that would take us to $1,500. A correction is needed first.
If friends are seeing so many gold stories, so is everyone else. It is the golden bullâs primary and malicious objective to shake off as many investors as possible trampling them in the process. (This is why we urge our Subscribers to hold on to long-term positions and enjoy the ride - only a powerful combination of multiple strong bearish signals would make us consider selling our long-term positions.)
Gold is particularly attractive since the Fed has cut interest rates essentially to zero. Gold is more attractive than money in the bank. You donât earn interest on either gold or cash, so by holding gold today youâre not giving up interest. But you also don't give up the potential of goldâs bull run. The Fed can keep printing cash. It canât print gold.
It seems that gold will need to consolidate before going higher. Once the correction is done, itâs not out of question that the price of gold will reach $1,500. I seriously doubt that the recent run up is the final stage of the bull market. In fact, it seems that there are several more good years. Weâre looking forward to it, especially in silver.
We look at the long-term chart for silver chart (charts courtesy by http://stockcharts.com) to answer the question âHow high will the rally in silver go before consolidating?" We compare previous breakouts in order to measure and estimate probable target levels for the near-term.
Bull markets often can be studied using self-similar pattern ideology. In other words, patterns seen previously on a smaller scale can apply to the present on a larger scale. This is also why we use a logarithmic scale to present prices, since a previous $2 rally when silver was at $4, (a 50% move) may today be only a 10% move when silver is above $20.
An important observation is that local tops have been followed by sharp declines and then huge rallies. We have seen this pattern repeatedly. Very-short-term traders may wish to take advantage of these trends. If moves are to be made in these volatile times, we highly recommend using trailing stops. We will not try to time this move with our own capital, as we are not very-short-term oriented. Still, the full version of this essay includes timing details on the short-term chart.
The new target level for gold has been set around $1,500. Please take a look at the long-term gold chart below.
We obtain the $1,500 target by applying the 1.618 Phi number to previous local tops, specifically those seen in June of 2008 and June of 2010. This also coincides with the upper/steeper blue line in the above chart. Since it appears that we are indeed in the second stage of the bull market for gold, which began in 2008, the steeper rising trend channel seems the better choice for the long-term analysis at this time.
Before the lower, less steep line is surpassed, it is likely that gold will first reach a local top and then go through a quick consolidation. This will most likely result in a greater strength and increase the odds of a further rally being sustained. Subscribers to our Premium Service get the specific number projected for this local top. We base the number by extrapolating the span between the highs seen in 2006 and 2008. That is to say, if the percentage increase of 2008 over 2006 is repeated in this year as compared to 2008, then we get the specific number for the next local top.
Our readers may notice that we often use Phi number to analyze tops and bottoms, including the annotations on the above charts. This is not something random we have pulled out of a hat. The Phi number is also known as golden number, divine proportion, Latin sectio aurea and so on (read more about Phi here). This number is known for its wide use in art, mathematics, observation of nature and - of course â market analysis. Vladimir Lefebvre once demonstrated that humans exhibit positive and negative evaluations of the opinions they hold in a ratio that approaches Phi, with 61.8% positive and 38.2% negative. Assuming that changes in markets reflect human opinions, we can use Phi number in our analysis. Naturally, this goes much deeper than the quick sketch we just presented. The most important reason for applying the Phi number into market analysis is simply because it often works.
Summing up, gold is likely to reach a local top very soon and then consolidate. It is likely that it will then rally further, perhaps to $1,500. Several retracement level factors yield the same conclusions when applied to previous highs and lows seen during the past four years. We see further validation when studying gold from the perspective of other world currencies, including the Japanese yen.
To make sure that you are notified once the new features are implemented, and get immediate access to my free thoughts on the market, including information not available publicly, I urge you to sign up for my free e-mail list. Sign up today and you'll also get free, 7-day access to the Premium Sections on my website, including valuable tools and charts dedicated to serious PM Investors and Speculators. It's free and you may unsubscribe at any time.
Thank you for reading. Have a great and profitable week!
P. Radomski
http://www.marketoracle.co.uk/Article23197.htmlJoin our efforts to Secure America's Borders and End Illegal Immigration by Joining ALIPAC's E-Mail Alerts network (CLICK HERE)
-
10-03-2010, 06:15 PM #2Senior Member
- Join Date
- May 2007
- Location
- South West Florida (Behind friendly lines but still in Occupied Territory)
- Posts
- 117,696
Gold Short-term Looks Too Good
Commodities / Gold and Silver 2010
Oct 03, 2010 - 01:32 PM
By: Merv_Burak
Nine weeks of consistent upside action. It canât continue for much longer before something gives. Gold is once more becoming the talk of the town (or the financial columnists). That by itself is a warning of impending collapse. What do I think? See below.
GOLD : LONG TERM
The long term can be dispensed very quickly. Gold continues to move well above its positive sloping moving average line. The long term momentum indicator continues to move higher inside its positive zone and above its positive sloping trigger line. The volume indicator continues to push higher into new high territory and above its positive sloping trigger line. Finally, the long term P&F chart remains in a bullish trend. What more is there to say? The long term rating at this time remains BULLISH.
INTERMEDIATE TERM
Looking at the short term chart (next section) we see an intermediate term up trending channel which covers the gold price action for the past nine weeks. A consistent up trend such as this cannot continue but which is the most likely direction for gold to take. It could accelerate from here and break above that upper resistance channel line or it could move sideways and lower towards the lower channel support line. Should the price action accelerate from here breaking through that resistance line this would then have all the effect of a blow-off stage where we get a sudden sharp up move and the bullish trend then ends for some time. I would, however, suspect that the most likely scenario is for gold to take a breather and move sideways or a little lower, towards the lower support line. We can then reassess its move once it gets there, should that be the case. Not shown on the short term chart but quite evident on an intermediate term chart (with intermediate term indicators) are the intermediate term momentum and volume indicators. Both are in up trends and are trapped, similar to the gold price trend, in very tight up trending channels. The momentum up trend goes back to the same point as the gold price does while the volume up trending channel goes back to the Mid-May low point. In all three cases the indicators and gold price are butting up against their upper resistance channel trend lines. Although there is nothing that says these indicators cannot break above their respective resistance lines I would be inclined to think that the most likely scenario is similar to that mentioned for gold, sideways or lower from here. Gold could go slowly higher from here remaining just below its up trend resistance line and that should keep the indicators just below their lines but that might be asking for too much.
Despite all the above, the present technical position of gold is still very positive. If there is going to be a turn we should see it reflected first in the short term indicators and then in the intermediate term ones. Right now the price of gold remains above its positive moving average line and the momentum indicator remains inside its positive zone above its positive trigger line. The volume indicator is still quite positive and remains above its positive sloping trigger line. The intermediate term rating for gold therefore remains BULLISH. The short term moving average line remains above the intermediate term line for confirmation of the bull.
SHORT TERM
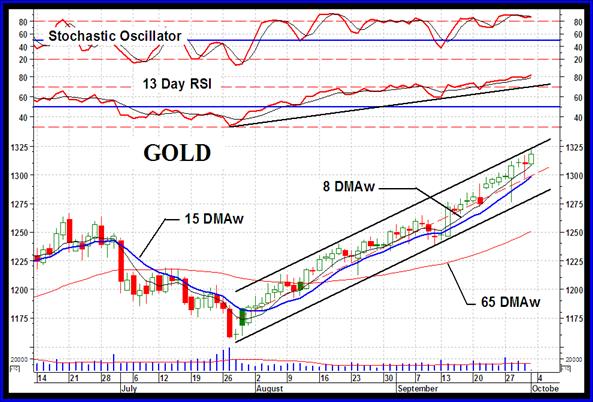
From the short term perspective everything still looks good but possibly too good. As the chart shows, everything seems to be going through the roof but maybe the roof is too strong and the result may be a tumble back to lower levels. An interesting pattern shown on the chart is the tightness of the daily gold action. Although it has been inside that up trending channel for 9 weeks most of that time it has been in the upper half of the channel line. In fact except for the very rare day here and there and a few days in mid-Sept it has spent all of its activities in that upper half. Such a tight up trending activity is quite seldom seen and results in an eventual drop to lower levels. A reversal of 50% of its upside move would not be surprising. Anything less of a reaction would confirm an on going long term strong bullish trend.
Going back to the short term we have the price of gold continuing above its positive sloping moving average line. The momentum indicator remains in its positive zone above its positive trigger line. In fact, the momentum indicator is in new high ground inside its overbought zone suggesting two things, a strong move in progress and a reversal of trend not too far ahead. When we do have a strong bullish move in the price it is not unusual for the momentum indicator to remain in its overbought zone for some time. In such cases a move below the overbought line, which is usually a signal that the reversal in price has started, may only be very temporary. Weâll have to see how things transpire from here. The daily volume action remains continuously low although it has perked up somewhat recently. All in all the short term rating remains BULLISH. The very short term moving average line remains above the short term line (where itâs been since late July) confirming the rating.
As for the immediate direction of least resistance, Iâll have to rely upon the flip of the coin again. Tails it is so I should go negative but I think Iâll go with the lateral direction. There are just too many positive indicators right now and that makes me cautious while a sudden reversal just doesnât seem in the works.
SILVER
That bright shine you see is the refection of the sun off silver. Silver continues to out perform gold. It is at new recovery highs and new bull market highs since hitting its low just above the $4 mark in late 2001. Unlike gold, however, it is not yet at all time highs. That was at the $41.50 level back in Jan of 1980. Looks like silver is heading in that direction again. Yes, I know that the price mentioned does not reflect the effects of inflation but only the super sophisticated really keep track of the inflation adjusted figures.
There seems to be a sharp disconnect between the actions of silver and that of the âqualityâJoin our efforts to Secure America's Borders and End Illegal Immigration by Joining ALIPAC's E-Mail Alerts network (CLICK HERE)


 Reply With Quote

EXPOSED! UNITED NATIONS HAS A SECRET PLAN TO INVADE AMERICA |...
05-20-2024, 11:43 PM in Videos about Illegal Immigration, refugee programs, globalism, & socialism