

Results 1 to 3 of 3
Thread Information
Users Browsing this Thread
There are currently 1 users browsing this thread. (0 members and 1 guests)
 LinkBack URL
 About LinkBacks
-
12-07-2009, 02:08 AM #1Senior Member


- Join Date
- May 2007
- Location
- South West Florida (Behind friendly lines but still in Occupied Territory)
- Posts
- 117,696
Jobs Contract 23rd Straight Month; Unemployment Rate Drop to
Friday, December 04, 2009
Jobs Contract 23rd Straight Month; Unemployment Rate Drop to 10.0%
This morning, the Bureau of Labor Statistics (BLS) released the November Employment Report. http://www.bls.gov/news.release/pdf/empsit.pdf
The unemployment rate edged down to 10.0 percent in November, and nonfarm payroll employment was essentially unchanged (-11,000), the U.S. Bureau of Labor Statistics reported today. In the prior 3 months, payroll job losses had averaged 135,000 a month. In November, employment fell in construction, manufacturing, and information, while temporary help services and health care added jobs.


Establishment Data
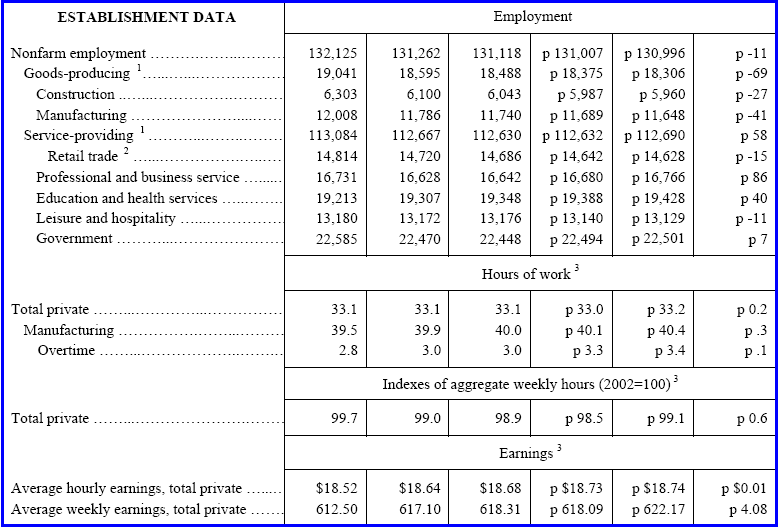
Highlights
* 11,000 jobs were lost in total vs. 190,000 jobs last month.
* 27,000 construction jobs were lost vs. 62,000 last month.
* 41,000 manufacturing jobs were lost vs. 61,000 last month.
* 58,000 service providing jobs were added vs. 61,000 lost last month.
* 15,000 retail trade jobs were lost vs. 40,000 last month.
* 86,000 professional and business services jobs were added vs. 18,000 added last month.
* 40,000 education and health services jobs were added vs. 45,000 added last month.
* 11,000 leisure and hospitality jobs were lost vs. 37,000 last month.
* 07,000 government jobs were added vs. 0 added last month.
A total of 69,000 goods producing jobs were lost (higher paying jobs). Retail and professional services contributed massively to to the plus side.
Note: some of the above categories overlap as shown in the preceding chart, so do not attempt to total them up.
Index of Aggregate Weekly Hours
Work hours were +.2 to 33.2. Short work weeks contribute to household problems. Moreover, before hiring begins at many places, work weeks will increase.
Birth Death Model Revisions 2008

Birth Death Model Revisions 2009
Birth/Death Model Revisions
After the typical in January in which the Birth/Death Model revisions bore some semblance of reality, the Birth/Death numbers remain in deep outer space. http://www.bls.gov/web/cesbd.htm
At this point in the cycle birth death numbers should have been massively contracting for months. The BLS is going to keep adding jobs through the entire recession in a complete display of incompetence.
Please note that one cannot subtract or add birth death revisions to the reported totals and get a meaningful answer. One set of numbers is seasonally adjusted the other is not. In the black box the BLS combines the two coming out with a total. The Birth Death numbers influence the overall totals but the math is not as simple as it appears and the effect is nowhere near as big as it might logically appear at first glance.
BLS Black Box
For those unfamiliar with the birth/death model, monthly jobs adjustments are made by the BLS based on economic assumptions about the birth and death of businesses (not individuals). Those assumptions are made according to estimates of where the BLS thinks we are in the economic cycle.
The BLS has admitted however, that their model will be wrong at economic turning points. And there is no doubt we are long past an economic turning point.
Here is the pertinent snip from the BLS on Birth/Death Methodology.
* The net birth/death model component figures are unique to each month and exhibit a seasonal pattern that can result in negative adjustments in some months. These models do not attempt to correct for any other potential error sources in the CES estimates such as sampling error or design limitations.
* Note that the net birth/death figures are not seasonally adjusted, and are applied to not seasonally adjusted monthly employment links to determine the final estimate.
* The most significant potential drawback to this or any model-based approach is that time series modeling assumes a predictable continuation of historical patterns and relationships and therefore is likely to have some difficulty producing reliable estimates at economic turning points or during periods when there are sudden changes in trend.
Household Data
In November, both the number of unemployed persons, at 15.4 million, and the unemployment rate, at 10.0 percent, edged down. At the start of the recession in December 2007, the number of unemployed persons was 7.5 million, and the jobless rate was 4.9 percent.
Among the major worker groups, unemployment rates for adult men (10.5 percent), adult women (7.9 percent), teenagers (26.7 percent), whites (9.3 percent), blacks (15.6 percent), and Hispanics (12.7 percent) showed little change in November. The unemployment rate for Asians was 7.3 percent, not seasonally adjusted.
The civilian labor force participation rate was little changed over the month at 65.1 percent. The employment-population ratio continued to decline in October, falling to 58.5 percent.
The number of people working part time for economic reasons (sometimes referred to as involuntary part-time workers) was little changed in November at 9.2 million. These individuals were working part time because their hours had been cut back or because they were unable to find a full-time job.
Persons Not in the Labor Force
About 2.3 million persons were marginally attached to the labor force in November, an increase of 376,000 from a year earlier. (The data are not seasonally adjusted.) These individuals were not in the labor force, wanted and were available for work, and had looked for a job sometime in the prior 12 months. They were not counted as unemployed because they had not searched for work in the 4 weeks preceding the survey.
Among the marginally attached, there were 808,000 discouraged workers in October, up from 484,000 a year earlier. (The data are not seasonally adjusted.) Discouraged workers are persons not currently looking for work because they believe no jobs are available for them. The other 1.6 million persons marginally attached to the labor force in October had not searched for work in the 4 weeks preceding the survey for reasons such as school attendance or family responsibilities.
Table A-5 Part Time Status

The chart shows there are 9.28 million people are working part time but want a full time job. A year ago the number was 7.3 million.
Note the trend in part-time work. In a recovery it should be headed down quickly. The reason is employers increase the hours of part-time workers before they start hiring full-time workers.
The key take-away from this series are the millions of workers whose hours will rise before companies start hiring more workers.
Table A-12
Table A-12 is where one can find a better approximation of what the unemployment rate really is. Let's take a look

Grim Statistics
The official unemployment rate is 10.0%. However, if you start counting all the people that want a job but gave up, all the people with part-time jobs that want a full-time job, all the people who dropped off the unemployment rolls because their unemployment benefits ran out, etc., you get a closer picture of what the unemployment rate is. That number is in the last row labeled U-6.
It reflects how unemployment feels to the average Joe on the street. U-6 is 17.2%. Both U-6 and U-3 (the so called "official" unemployment number) are poised to rise further although most likely at a slower pace than earlier this year.
Looking ahead, there is no driver for jobs and states in forced cutback mode are making matters far worse.
Unemployment is likely to continue rising until sometime in 2011.
Table A
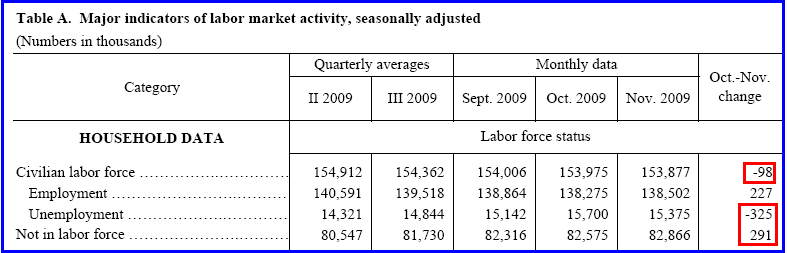
Explaining The Drop In Unemployment Rate
Table A explains the drop in the unemployment rate nicely.
Unemployment dropped by .2% even though 11,000 jobs were lost and it should take at least 100,000 jobs just to keep up with demographics. Instead note the drop in the civilian labor force by 98,000.
Moreover, those "not in the labor force dropped rose by 291,000 constituting nearly all of the decline in unemployment.
Finally, in a typical recovery, the participation rate should go up not down. The reason is people hear there is a recovery, hear things are getting better, hear the talk about "green shoots" and think there might be a job if they go looking.
Nonetheless it's the reaction to the data this is important and at least initially we see something new happening today: The stock market is up along with the dollar while treasuries, gold, and silver are all down.
It remains to be seen if this is another one-day-wonder of if this is a reversal of any major trends.
Mike "Mish" Shedlock
http://globaleconomicanalysis.blogspot.com
http://globaleconomicanalysis.blogspot. ... month.htmlJoin our efforts to Secure America's Borders and End Illegal Immigration by Joining ALIPAC's E-Mail Alerts network (CLICK HERE)
-
12-07-2009, 11:09 AM #2Senior Member

- Join Date
- Nov 2009
- Location
- Austin, Texas
- Posts
- 260
That is because Truman served for his country in the military.
We are in an age where the people we are electing to political positions, have no military backgrounds. Actually, we are electing radical hippies and the radically taught children of the 60's and 70's.
The draft should have never been dropped.
Disrespectful and passive generations, have come to the age of power. You can see the effects and loss of American pride all around us today.
It took 200 years to build us to the leader of the world. it only took 33 years to destroy all that has been built.Travis and Crockett, are flopping in their graves
-
12-07-2009, 11:22 AM #3Senior Member

- Join Date
- Mar 2007
- Location
- Grant Township Mi
- Posts
- 3,473
That's because it's always easier to destroy than to build.


 Reply With Quote


GALLUP POLL: Immigration the most pressing issue in America for...
05-03-2024, 11:30 PM in General Discussion