

Results 1 to 2 of 2
Thread Information
Users Browsing this Thread
There are currently 1 users browsing this thread. (0 members and 1 guests)
 LinkBack URL
 About LinkBacks
-
02-05-2010, 09:59 PM #1Senior Member


- Join Date
- May 2007
- Location
- South West Florida (Behind friendly lines but still in Occupied Territory)
- Posts
- 117,087
Jobs Contract Yet Again; Unemployment Rate Drops To 9.7%?
Friday, February 05, 2010
Jobs Contract Yet Again; Unemployment Rate Drops To 9.7%
In the continuing theater of BLS absurdities, the unemployment rate fell to 9.7% in spite of a 25th consecutive month of job losses. Some stopped counting at 22 months in November. However, I find November questionable.
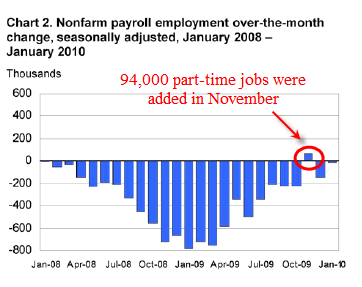
This month professional services contributed 44,00 jobs to the plus side, but 52,000 of them were part-time jobs. Amazingly a table below shows the number of part-time workers decreased by 849,000 from last month. Go figure.
Moreover, the so-called 64,000 rise in November can be attributed to the seasonally adjusted hiring of 94,000 temporary workers. Here is a look at revisions ....
BLS Revisions

Household Revisions
The above table does not affect the unemployment rate. Revisions to the Household Survey do. Here are the household revisions.

Bingo. Just like that the population shrank as did the civilian labor force.
For some reason the BLS does this in pieces. The following chart shows the result.

There are now a whopping 2.5 million people without a job but want one, yet are not counted as unemployed.
So yes, the "official unemployment rate" can hold its own or even drop with this kind of nonsense.
Now for a closer look at the report ....
This morning, the Bureau of Labor Statistics (BLS) released the January 2010 Employment Report. http://www.bls.gov/news.release/pdf/empsit.pdf
The unemployment rate fell from 10.0 to 9.7 percent in January, and nonfarm payroll employment was essentially unchanged (-20,000), the U.S. Bureau of Labor Statistics reported today. Employment fell in construction and in transportation and warehousing, while temporary help services and retail trade added jobs..

Establishment Data
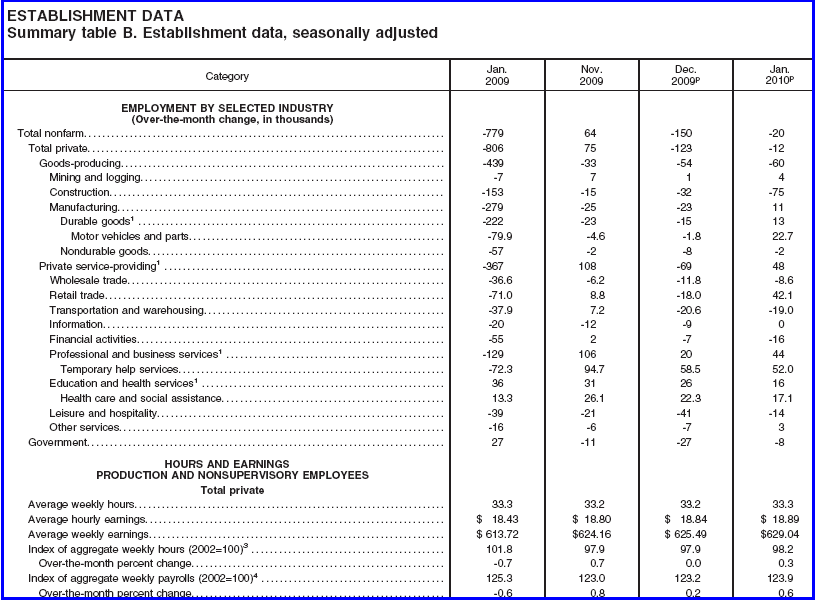
Highlights
* 20,000 jobs were lost in total vs. 150,000 jobs last month.
* 75,000 construction jobs were lost vs. 32,000 last month.
* 11,000 manufacturing jobs were added vs. 23,000 lost last month.
* 48,000 service providing jobs were added vs. 69,000 lost last month.
* 42,000 retail trade jobs were added vs. 18,000 lost last month.
* 44,000 professional and business services jobs were added vs. 20,000 last month.
* 16,000 education and health services jobs were added vs. 26,000 last month.
* 14,000 leisure and hospitality jobs were lost vs. 41,000 last month.
* 8,000 government jobs were lost vs. 27,000 last month.
* 52,000 temporary help jobs were added vs 58,000 last month and a whopping 94,000 in November.
Look at that last line again.
November added 94,000 temporary jobs seasonally adjusted. Even if true it is hardly anything to crow about but it does explain the positive job growth in November.
A total of 60,000 goods producing jobs were lost (higher paying jobs). Professional services contributed 44,00 jobs to the plus side, but 52,000 of them were part-time jobs! Amazingly a table below shows the number of part-time workers decreased by 849,000 from last month.
Note: some of the above categories overlap as shown in the preceding chart, so do not attempt to total them up.
Index of Aggregate Weekly Hours
Work hours were up one tick to 33.3. Short work weeks contribute to household problems. Moreover, before hiring begins at many places, work weeks will increase.
Birth Death Model Revisions 2009

Birth Death Model Revisions 2009

Birth/Death Model Revisions
There are so many revisions and the BLS Birth/Death Model methodology so screwed up it is pointless to further comment other than to repeat a few general statements. http://www.bls.gov/web/cesbd.htm
Please note that one cannot subtract or add birth death revisions to the reported totals and get a meaningful answer. One set of numbers is seasonally adjusted the other is not. In the black box the BLS combines the two coming out with a total. The Birth Death numbers influence the overall totals but the math is not as simple as it appears and the effect is nowhere near as big as it might logically appear at first glance.
BLS Black Box
For those unfamiliar with the birth/death model, monthly jobs adjustments are made by the BLS based on economic assumptions about the birth and death of businesses (not individuals). Those assumptions are made according to estimates of where the BLS thinks we are in the economic cycle.
The BLS has admitted however, that their model will be wrong at economic turning points. And there is no doubt we are long past an economic turning point.
Here is the pertinent snip from the BLS on Birth/Death Methodology.
* The net birth/death model component figures are unique to each month and exhibit a seasonal pattern that can result in negative adjustments in some months. These models do not attempt to correct for any other potential error sources in the CES estimates such as sampling error or design limitations.
* Note that the net birth/death figures are not seasonally adjusted, and are applied to not seasonally adjusted monthly employment links to determine the final estimate.
* The most significant potential drawback to this or any model-based approach is that time series modeling assumes a predictable continuation of historical patterns and relationships and therefore is likely to have some difficulty producing reliable estimates at economic turning points or during periods when there are sudden changes in trend.
Household Data
In January, the number of unemployed persons decreased to 14.8 million, and the unemployment rate fell by 0.3 percentage point to 9.7 percent.
The number of long-term unemployed (those jobless for 27 weeks and over) continued to trend up in January, reaching 6.3 million. Since the start of the recession in December 2007, the number of longterm unemployed has risen by 5.0 million.
In January, the civilian labor force participation rate was little changed at 64.7 percent. The employment-population ratio rose from 58.2 to 58.4 percent.
The number of persons who worked part time for economic reasons (sometimes referred to as involuntary part-time workers) fell from 9.2 to 8.3 million in January. These individuals were working part time because their hours had been cut back or because they were unable to find a full-time job.
Persons Not in the Labor Force
About 2.5 million persons were marginally attached to the labor force in January, an increase of 409,000 from a year earlier. (The data are not seasonally adjusted.) These individuals were not in the labor force, wanted and were available for work, and had looked for a job sometime in the prior 12 months. They were not counted as unemployed because they had not searched for work in the 4 weeks preceding the survey.
Among the marginally attached, there were 1.1 million discouraged workers in January, up from 734,000 a year earlier. (The data are not seasonally adjusted.) Discouraged workers are persons not currently looking for work because they believe no jobs are available for them. The remaining 1.5 million people marginally attached to the labor force had not searched for work in the 4 weeks preceding the survey for reasons such as school attendance or family responsibilities.
Table A-8 Part Time Status
Note: many table numbers have changed. Last month and for as long as I remember, this used to be Table A-5.

Grim Statistics
The official unemployment rate is 9.7%. However, if you start counting all the people that want a job but gave up, all the people with part-time jobs that want a full-time job, all the people who dropped off the unemployment rolls because their unemployment benefits ran out, etc., you get a closer picture of what the unemployment rate is. That number is in the last row labeled U-6.
It reflects how unemployment feels to the average Joe on the street. U-6 is 16.5%. Both U-6 and U-3 (the so called "official" unemployment number) are poised to rise further although most likely at a slower pace than earlier this year.
Looking ahead, there is no driver for jobs and states in forced cutback mode are making matters far worse.
Mike "Mish" Shedlock http://globaleconomicanalysis.blogspot. ... yment.htmlJoin our efforts to Secure America's Borders and End Illegal Immigration by Joining ALIPAC's E-Mail Alerts network (CLICK HERE)
-
02-05-2010, 11:11 PM #2Senior Member

- Join Date
- Aug 2005
- Posts
- 55,877
It's a game. Each month they reduce the size of the civilian labor force so they can then reduce the amount of the unemployed, despite the people they took off the civilian labor force are still there looking for and needing jobs. But I read an article that shows how they determine the size of the civilian labor force ... it's from the reports from the companies as to how many jobs they need, not from how many people there are in our economy who need jobs.
Is't that unbelievable??!! What a rotten despicable lie the unemployment is. I've known this for awhile because this isn't the first time the unemployment rate goes down while the actual number of unemployed goes up. Our government has deliberately not been reporting unemployment for several years which means hiding the true condition and state of our economy has been a deliberate and planned deception.A Nation Without Borders Is Not A Nation - Ronald Reagan
Save America, Deport Congress! - Judy
Support our FIGHT AGAINST illegal immigration & Amnesty by joining our E-mail Alerts at https://eepurl.com/cktGTn


 Reply With Quote

BREAKING: Outrage After Illegal Alien Semi-Truck Driver Who...
07-14-2026, 09:20 PM in illegal immigration News Stories & Reports