

Results 1 to 1 of 1
Thread Information
Users Browsing this Thread
There are currently 1 users browsing this thread. (0 members and 1 guests)
 LinkBack URL
 About LinkBacks
-
02-15-2024, 06:17 PM #1Senior Member


- Join Date
- Aug 2018
- Posts
- 63,037
Bidens economic record tied to illegal migrant employment surge, says report
Bidens economic record tied to illegal migrant employment surge, says report
02/14/2024 // News Editors // 730 Views
Tags: american workers, big governent, big government, border security, Bubble, Collapse, economic riot, economy, employment, illegal immigration, Immigration, invasion usa, job growth, Joe Biden, labor force, market crash, migrants, national security, Open Borders, real investigations, risk, truth

A report highlights the significant role of illegal migrant employment in President Joe Bidens job growth figures, amidst a shortfall in American employment levels since 2019.
(Article republished from YourNews.com)
President Joe Bidens administration has seen a notable increase in jobs, attributed significantly to the employment of 2.9 million migrants, even as the number of employed Americans has not reached pre-pandemic levels, according to the Center for Immigration Studies. Steven Camarota, the author of the report titled All Employment Growth Has Gone to Immigrants, Compared to 2019, highlighted the substantial growth in immigrant employment under Bidens tenure.
Camarota pointed out that despite the growth in jobs, the employment rate for U.S.-born Americans has not recovered to its 2019 benchmark. The report clarifies that American job seekers are not being overlooked in favor of migrant workers but emphasizes that the jobs added since 2019 have predominantly been filled by migrants.
A contributing factor to the lower employment rates among Americans is the retirement of older individuals and the limited entry of young Americans into the workforce. This demographic shift encourages employers to hire migrants. Camarota also noted the preference of employers for migrants over approximately five million American men who are not in the workforce due to various reasons, including health issues, criminal records, and lack of job search efforts. These individuals are often not considered unemployed as they have not sought work in the preceding month, leading to their classification as not participating in the labor force.
Furthermore, Camarotas report sheds light on the low labor force participation rate among U.S.-born men without a college degree, which has not returned to its 2019 level. The Biden administrations policies, which have resulted in the arrival of over 6.2 million illegal migrants, are seen as facilitating this situation by making it more appealing for employers to hire migrants.
The impact of opioid addiction on the American workforce was discussed, with Douglas Holtz-Eakin, president of the American Action Forum, highlighting during a House hearing that opioid use has significantly reduced the labor force, pushing employers towards hiring migrants. The testimony pointed out the dire consequences of opioid-related deaths and its effect on worker availability.
The strategy of relying on migrant labor for economic growth has been particularly evident in coastal cities, with policies that create low-wage jobs filled by migrants. This approach, criticized for reducing wages and increasing reliance on welfare, is seen as bolstered by Democratic policies. Critics argue that restricting migrant labor would force employers to invest in higher-wage, higher-productivity jobs, especially in the Heartland, where many sidelined Americans reside.
The influx of migrants since the 1990s has contributed to a labor market characterized by low wages and reduced investment in American workers. This shift has benefited investors and certain sectors at the expense of American workers wages and job quality. The Congressional Budget Office reported that Bidens migration policies are likely to exert downward pressure on average real wages, with projections indicating a continued decline in labor incomes share of GDP.
The reliance on migrant labor is part of a broader economic policy that shifts resources and attention away from American communities, exacerbating issues such as the Deaths of Despair. Critics argue that this focus detracts from addressing the needs and challenges facing American workers and their families.
READ THE FULL REPORT:
The Employment Situation of Immigrants and the U.S.-born in the Fourth Quarter of 2023
Compared to 2019, all employment growth has gone to the foreign-born
By Steven A. Camarota and Karen Zeigler
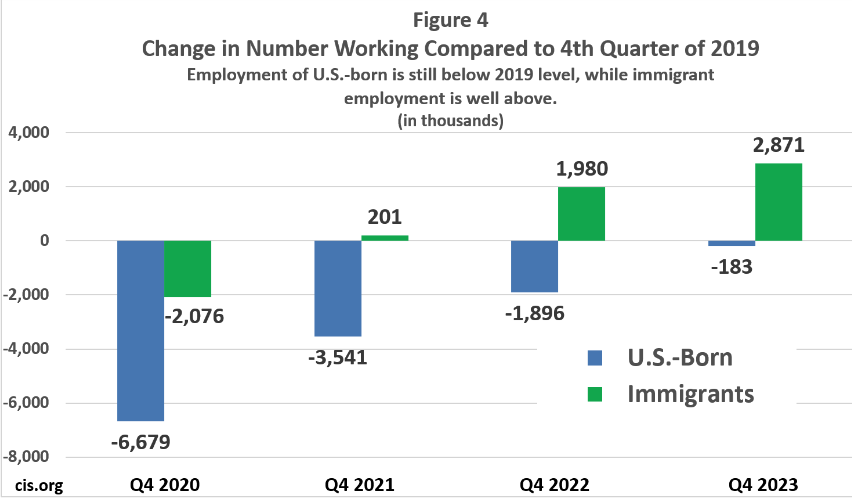
Comparing the fourth quarter of 2019 to the fourth quarter of 2023 shows 2.7 million more people working in the United States 2.9 million more immigrants (legal and illegal) and 183,000 fewer U.S.-born Americans. Since the depths of the Covid Recession in 2020 employment has increased for both groups. But the number of U.S.-born workers has not made it back to the 2019 pre-Covid level. Equally important, the share of working-age, U.S.-born men without a bachelors not in the labor force deteriorated in the decades prior to 2019, and the rate in the fourth quarter of 2023 was lower still. These individuals do not show up as unemployed because they have not looked for a job in the four weeks prior to the survey. The long-term decline in the labor force participation rate of less-educated men is linked to serious social problems, from suicide and crime to drug overdoses and social isolation.
This analysis by the Center for Immigration Studies is based on the Current Population Survey (CPS), collected by the Census Bureau for the Bureau of Labor Statistics. We focus on the peak years of prior economic expansions (2000, 2006, and 2019) as well as 2023 because it is the most recent quarterly data available. Immigrants (legal and illegal together) in the CPS are often referred to as the foreign-born and include all persons who were not U.S. citizens at birth primarily naturalized citizens, lawful permanent residents, long-term temporary visitors (e.g. guestworkers), and illegal immigrants.
Among the findings:
- While the numbers have continually rebounded from the lows of 2020, there were still 183,000 fewer U.S.-born Americans working in the fourth quarter of 2023 than in the fourth quarter of 2019, before Covid. The number of immigrants (legal and illegal) working is up 2.9 million over 2019. (Figure 4 and Table 2)
- The unemployment rate in the fourth quarter of 2023 was 3.5 percent and 3.7 percent for the U.S.-born and immigrants respectively. However, the unemployed do not include those out of the labor force neither working nor looking for work. (Table 2 and Table 8
- The overall labor force participation rate of all U.S.-born adults (18 to 64) in the fourth quarter of 2023 of 77 percent roughly matches the pre-covid rate in 2019. But it was still below the prior peaks of 78.1 percent in 2006 and 79.2 percent in 2000. (Figure 1 and Table 3)
- Immigration has added significantly to the number of workers without a bachelors degree. Of the 2.9 million increase in immigrant workers, 1.7 million (60 percent) are adults 18 and older without a bachelors degree. (Table 2 and Table 6)
- At 75.6 percent in the fourth quarter of 2023, the labor force participation rate of U.S.-born men without a bachelors (18 to 64) has still not returned to the 76.3 percent it was in the fourth quarter of 2019, which was lower than the 80.5 percent in 2006 and the 82.6 percent in 2000. (Figure 7, Tables 8-11)
- Compared to the 1960s, when more than 90 percent of these working-age, less-educated U.S.-born men were in the labor force, the rate today is dramatically lower.
- At 66.4 percent, the labor force participation rate of U.S.-born women (18 to 64) without a bachelors in the fourth quarter of 2023 has returned to the 2019 level, but is still well below the 70.7 percent in 2000. (Tables 8, 9, and 11)
- The share of immigrant men (18 to 64) in the fourth quarter of 2023 without a bachelors degree in the labor force is 85.5 percent, higher than the rate for U.S.-born men, but still below the 86.4 percent in 2019. (Figure 7, Table 8, and Table 9)
- There were a total of 43.5 million U.S.-born men and women (16 to 64) of all education levels not in the labor force in the fourth quarter of 2023 8.6 million more than in 2000. More than two-thirds of the U.S.-born not in the labor force are adults 18 to 64 without a bachelors degree. (Table 1 and Table 5)
- The total number of U.S.-born and immigrants of working age (16 to 64), both sexes and all education levels not working unemployed or not in the labor force was 59 million in the fourth quarter of 2023. This is an enormous pool of potential workers to draw upon. This figure includes 320,000 unemployed people 65 and older. (Tables 1 and 2)
- In addition to the working-age, the labor force participation of those ages 65 to 74 increased steadily until 2019. But it fell significantly during the pandemic and at 26.5 percent for the U.S.-born and 30.9 percent for immigrants in the fourth quarter of 2023 it has not returned to the pre-Covid 2019 level for either group. (Table 7)
Data and Methods
This report uses the public-use files of the Current Population Survey (CPS) from the fourth quarter (October, November, and December) of each year from 2000 to 2023 to examine the employment situation in the United States, with particular attention paid to differences between immigrants and the U.S.-born. The raw data used in this analysis comes directly from the Census Bureaus website, which collects the data for the Bureau of Labor Statistics (BLS). Based on a monthly survey of 60,000 households, the CPS is the nations primary source for the unemployment rate and other labor force statistics and is sometimes referred to as the household survey. The survey is weighted to reflect the actual size and demographic makeup of the civilian non-institutionalized population, so it does not include those in prisons and nursing homes.
Key Concepts and Terms. The labor force includes all workers, plus those who are not working but report in the CPS that they looked for work in the four weeks prior to the survey. There are three measures of labor force attachment used in this analysis. First, we report statistics using the standard unemployment rate, referred to by the BLS as the U-3 rate. It is calculated by dividing the number of people actively looking for work in the last four weeks by the number in the labor force (working or looking). Because of the way it is calculated, those not in the labor force are not included in the official unemployment rate. Second, there is the labor force participation rate, which is the share of people in the labor force, often confined to a particular age group, such as 16 to 64. It is calculated by taking the share working or looking for work and dividing it by all persons in the age group of interest. Sometimes the BLS reports labor force participation for all persons 16 and older, including those of retirement age. But such statistics confound the impact of population aging with the phenomenon of declining participation in the labor force among the working-age, which is our focus here. Third, there is the share of the population that is employed, which is referred to as the employment rate. It reflects the share of the population that is working divided by all persons (working and not working) in the age group of interest.
Definition of Immigrant. The term immigrant has a specific meaning in U.S. immigration law, which is all those inspected and admitted as lawful permanent residents. In this analysis, we use the term immigrant in the non-technical sense of the word to mean all those who were not U.S. citizens at birth. Typically, the government refers to these individuals in surveys such as the CPS as the foreign-born, which includes all persons who were not U.S. citizens at birth. They include naturalized citizens, permanent residents (green card holders), temporary visitors, guestworkers, and illegal aliens. While it may surprise some, the BLS is clear that illegal immigrants are included in the survey, though some fraction are missed by the CPS.
Matching Published BLS Tables. In this report, all statistics covering the entire population, such as the unemployment rate, match those published by the BLS. However, the counts and percentages for sub-populations will in some cases be slightly different. The reason is that the Census Bureau adds perturbations to the public-use microdata to protect respondent confidentiality. Fortunately, the Census Bureau states that any differences between published figures and those calculated from the public-use data will be so small that they fall well within the sampling variability associated with CPS estimates. In other words, there should be no meaningful difference between statistics calculated from the pubic-use data and those published by the BLS.
Seasonal Adjustment. The figures in this report are not seasonally adjusted. Unadjusted figures are conceptually simpler and easier for other researchers to replicate. Also, the limited number of statistics on the foreign-born published in the BLS monthly Employment Situation (Table A-7) reports are, like those reported here, not seasonally adjusted. Finally, comparing the same quarter each year, as we do in this analysis, essentially controls for that variability.
Potential Problems with the Data Due to Covid. The Bureau of Labor Statistics (BLS) reports potential problems with the CPS since March 2020 because of the Covid-19 pandemic. First, interviewers who administered the survey miscoded some respondents as employed when they were on furlough, temporary layoff, or similar situations. They should have been considered temporarily laid-off and coded as unemployed. The number unemployed and the unemployment rate would be higher in March 2020 through December 2021 if these individuals were counted as unemployed. Second, the response rates for March 2020 through December 2021 were significantly lower than prior to Covid-19, though rates have improved since hitting a low in June 2020. These lower rates increase the sampling error of the survey. However, in June 2020, when the problem was most pronounced, BLS stated that Although the response rate was adversely affected by pandemic-related issues, BLS was still able to obtain estimates that met our standards for accuracy and reliability.
Neither the Census Bureau, which collects the data, nor the BLS has altered the data in response to these issues. Our analysis takes the raw CPS data as provided and our results match published non-seasonally adjusted figures, with the caveats about perturbations in public-use data discussed above.
Potential Issue with Sample Weights. One potential issue with the data not discussed by the Census Bureau or BLS is that the rapid increase in the immigrant population since 2021 may explain the decline in the total U.S.-born due to the way the data is weighted. Adding up the employed, unemployed, and those not in the labor force in Table 1 shows a U.S.-born working-age (16-64) population that was 287,000 fewer in 2020 than 2019, then a 1.66 million decline 2020 to 2021, then a rebound of 346,000 million in 2022 and an additional increase of 532,000 in 2023. This seems implausible, as most Covid deaths were in the older age cohorts and there is no evidence of sudden swings in migration patterns. As we have discussed in prior reports, this decline likely reflects the way the survey is weighted. It also is due to simple sampling variability.
Like virtually all modern surveys, the survey is controlled to a total target population each month that is basically pre-determined reflecting what the Census Bureau believes is the actual size and composition of the population across demographic characteristics carried forward each month. Each January, the weights are readjusted by race, sex, age, and other factors as new information about births, deaths, and net international migration becomes available.
Nativity is not one of the characteristics used to weight the data. This means that the identification of the foreign-born reflects what survey respondents tell interviewers, much like employment status. Given that respondents can only be either U.S.- or foreign-born and the survey is controlled to a target population each month, an increase in the foreign-born must make the U.S.-born population smaller. As a result, it is not really possible to look at the growth in the two populations relative to each other within the same calendar year, though this should not be a problem when making year-over-year comparisons as we do in this analysis. However, this is only true if the bureau is correctly re-weighting the data at the beginning of each year. If, as we have argued elsewhere, it is understating the arrival of immigrants, then the overall population totals will be different. This means that as the share of people reporting they are foreign-born increases, as it has dramatically in the last two years, the U.S.-born population will decline in the survey.
If we are correct that the weights are off due to an underestimation of the net migration of the foreign-born, then the actual U.S.-born and foreign-born populations are larger than reported here. How much larger is difficult to say. But if the weights were corrected, it is possible it would show both more natives and immigrants working, but also more not in the labor market as well.+
Read more at: YourNews.com
Bidens economic record tied to illegal migrant employment surge, says report NaturalNews.comIf you're gonna fight, fight like you're the third monkey on the ramp to Noah's Ark... and brother its starting to rain. Join our efforts to Secure America's Borders and End Illegal Immigration by Joining ALIPAC's E-Mail Alerts network (CLICK HERE)


 Reply With Quote
Similar Threads
-
Border Patrol Chief Blames Biden Policies For Illegal Migrant Surge: There Are No Co
By Airbornesapper07 in forum General DiscussionReplies: 1Last Post: 08-31-2022, 07:40 AM -
Shock Report: Biden Admin Prepares for Up to 400,000 Migrant Surge in October
By Scott-in-FL in forum illegal immigration News Stories & ReportsReplies: 0Last Post: 10-01-2021, 03:22 PM -
Migrant surge sets 21-year record in July: CBP
By Airbornesapper07 in forum Videos about Illegal Immigration, refugee programs, globalism, & socialismReplies: 1Last Post: 08-14-2021, 08:57 PM -
2010 Census Hiring Employment Scam massive surge Employment
By AirborneSapper7 in forum Other Topics News and IssuesReplies: 0Last Post: 01-09-2010, 12:25 PM -
Canada faces prospect of illegal migrant surge: Report
By OneNationUnderGod in forum illegal immigration News Stories & ReportsReplies: 5Last Post: 12-18-2009, 12:25 PM


MS-13 illegals kidnap and sacrifice 14 year old girl to the devil
04-27-2024, 11:00 AM in Videos about Illegal Immigration, refugee programs, globalism, & socialism